Shifting is a sensation that has taken over Major League Baseball the past few years and its implementation has been well documented in recent books such as Travis Sawchik’s “Big Data Baseball” and Ben Lindbergh and Sam Miller’s “The Only Rule Is It Has to Work.” As the popularity of the use of the shift in the game has grown, simultaneously it has created a debate between the new age stat heads and the old-school traditionalists. At one point, Rob Manfred even discussed whether or not he would be willing to ban the use of the shift. But despite the widespread usage of the shift in MLB and a front office led by the Sandy Alderson, the Mets still tend to lag behind.
Recently I read an article on BP Milwaukee exploring the shifting patterns of the Milwaukee Brewers, and thought it interesting to look at the Mets in the same way to see how they have embraced the shift and how they use it relative to the rest of the league.
Early Adapters but Now Lag
Data on shifting starting from 2010 is now available from FanGraphs.com in terms of how often teams shift and how they perform when they shift. The Mets are an interesting team I quickly realized in that while they were quick to adopt the shift, they first fluctuated from 2010 to 2011, which is presumably due to the change in manager from Jerry Manuel to Terry Collins. However, as expected, since 2011, the Mets have increased the percentage of times they use the shift.
| # of Shift | Percentage | |
| 2010 | 207 | 2.57% |
| 2011 | 129 | 2.36% |
| 2012 | 271 | 4.88% |
| 2013 | 199 | 6.71% |
| 2014 | 266 | 11.83% |
| 2015 | 506 | 19.50% |
| 2016 | 478 | 28.20% |
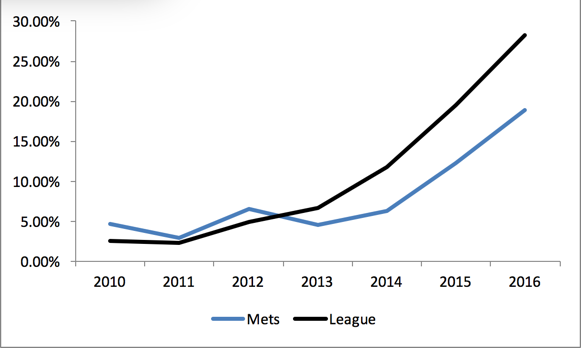
However, what is even stranger about the Mets is their tendencies relative to the rest of the league. While being leaders in shifting the first few years (2010 to 2012), by 2013 they fell behind the league average and have continued to be in the bottom third of the league for the past two and a half seasons.
| Mets | League | Rank | |
| 2010 | 4.70% | 2.57% | 2 |
| 2011 | 2.89% | 2.36% | 5 |
| 2012 | 6.52% | 4.88% | 8 |
| 2013 | 4.55% | 6.71% | 18 |
| 2014 | 6.36% | 11.83% | 25 |
| 2015 | 12.25% | 19.50% | 28 |
| 2016 | 18.91% | 28.20% | 26 |
This is more notable in the following graph which shows the similar trends of the New York Mets. While they have been increasing their usage they have continuously lagged behind the rest of the league. It could be possible that this drop in shifting coincides with the rise of the New York Mets star pitchers. Zach Wheeler in particular during the 2014 season asked the Mets to shift less when he was pitching, as he is a non-believer in analytics and blamed shifting for ground balls getting through the holes that he claims would normally be covered.
How the Mets fared while using the shift:
The Mets in the early days of the shift (2010 and 2011) were less successful than the rest of the league when utilizing it as the BAPIP against them was much higher than the league average. However as the Mets have cut down on their shifting compared to the rest of the league, it does appear to be working when they are using it. Particularly since 2012 they’ve had a BAPIP lower than that of league average against the shift meaning that they are preventing hits on balls that go into play. So despite them not using the shift nearly as much as the rest of the league, they are at least successful in the situations when they do choose to utilize it.
| Shifting | Non-Shifting | |||
| Mets | League | Mets | League | |
| 2010 | 0.338 | 0.306 | 0.294 | 0.293 |
| 2011 | 0.295 | 0.289 | 0.300 | 0.291 |
| 2012 | 0.251 | 0.301 | 0.293 | 0.293 |
| 2013 | 0.271 | 0.291 | 0.296 | 0.294 |
| 2014 | 0.278 | 0.297 | 0.296 | 0.295 |
| 2015 | 0.285 | 0.287 | 0.288 | 0.298 |
| 2016 | 0.282 | 0.297 | 0.308 | 0.297 |
One particular reason that the Mets might use the shift less than the rest of the league despite their success against it is that opposing hitters tend to pull the ball against them less than versus any other team. When the Mets don’t shift, opposing hitters have a pull rate against them of 36.4 percent–second lowest to the Padres at 36.3 percent. However, even when they do shift, the ball is pulled only 37.2 percent of the time. Meaning that there is very small difference in terms of the ball being pulled when the Mets do shift vs. when the Mets do not shift. Even split by left-handed and right-handed hitters there is a similar pattern. Right-handed hitters pull the ball 37.8 percent of the time versus the Mets (second-lowest in the league where the average is 39.4 percent of the time) and left-handed hitters only pull the ball versus the Mets 37.4 percent of the time (fourth-lowest in the league where the average is 39.5 percent). Therefore the Mets pitching staff and the way they pitch to hitters may actually be influencing why they are shifting less.
It is strange how little the Mets do tend to shift relative to the rest of the league. Luckily they have been able to be successful despite not having to utilize the shift. However, with the rest of baseball continuing to use the shift going forward, I would expect the Mets to continue to use it and follow suit.
How did the Mets fare against the shift?
So while the Mets seemed to have had success against the shift, let’s see how they are performing on offense when going against the shift. Not surprisingly, the New York Mets are struggling offensively both when they face a traditional defense and when they face the shift. Since 2010, the New York Mets have faced the shift 2,710 times including over 1,000 plate appearances against it this season. Over the past six-plus seasons, the Mets have hit .291 against the shift (23rd in the league) while similarly they have hit .292 when not facing the shift (also 23rd in the league). However for 2016, the Mets have been BABIP’d, meaning that no matter how they hit the ball it is being turned outs. For the 2016 season alone the New York Mets are hitting .280 against the shift and .278 when not facing the shift (both are 29th in the league).
The hitters with the biggest problems against the shift since 2010 for the Mets and leading the offensive problems are Lucas Duda and Curtis Granderson. Duda has a BABIP of only .269 and pulls the ball 42 percent of the time. Granderson when he gets shifted is performs similarly with a BABIP of .280 and pulls the ball 44 percent of the time. During the 2016 season Asdrubal Cabrera has hit it into the shift 48 percent of time.
Conclusion
The Mets like other teams will have to continue to adopt new found analytical ways to remain competitive in Major League Baseball. While they continue to lag behind they have been able to remain competitive through their dominant pitching and offense that is good enough to win games. But going forward they may need to find some other competitive edge if they want to make it to the World Series again.
(That edge is probably not acquiring Jay Bruce, in my opinion.)
Photo Credit: Jake Roth-USA TODAY Sports