
Two of the most important things to consider when evaluating a pitcher are their walk and strikeout rates. If you take a look at the Mets recent lineup decisions, you could argue that Met pitchers have to carry even more weight than their peers around baseball. Terry Collins has put his best bats in the lineup, sacrificing defense. A pitcher who can’t strike out opposing batters or walks them may not be able to rely on his defense to help prevent runs.
With Matt Harvey out for the rest of the season, the Mets have turned to Logan Verrett as a replacement. Verrett was a solid option in his rookie season, striking out 20.5 percent of opposing batters while walking 7.9 percent. In 2016 he has faced 360 opposing batters, striking out 15.3 percent of them while walking 10.3 percent. These are awful numbers even for a fifth starter. There were only been 11 pitchers who have combined this level of wildness and low strikeout rates while facing at least 300 batters before the trading deadline from 2010-14 (I can’t add 2015 to my Retrosheet-based database without a working Windows machine.) Three of them didn’t pitch in the majors after the deadline that season. Three more pitched but faced less than 150 batters. Only five took a regular turn in the rotation after the deadline.
It’s hard to know exactly what to expect from Verrett from the rest of the season. We know he has been really bad so far, but he hasn’t been a full time starter this year. If you read Baseball Prospectus on a regular basis, small sample size is probably a part of your vocabulary. However, it’s a bad idea to assume that Verrett will “regress to the mean” just because he was one of the worst pitchers in the majors through the trade deadline. Players perform at their talent level, plus or minus a certain amount of random chance. Line drives sometimes get caught. Umpires can make mistakes that hurt or help a pitcher. Over the course of a season, things like umpire mistakes should balance out to some degree. This means if a pitcher has the same underlying level of talent throughout the season, then their walk and strikeout rates should get closer to their talent level, not the league average.
To try and explain how this works, I took every pitching season where a pitcher faced at least 300 batters before August 1 and 150 batters on August 1 or later. I chose this number to try and get more pitching seasons than would qualify for the ERA title. If I chose a higher batters faced threshold I would get fewer seasons but also less variance in how someone performed in each part of the season. Working with my database of 2010-14, I have 541 qualifying pitcher-seasons. For starters, let’s look at the range of walk rates after the trade deadline.
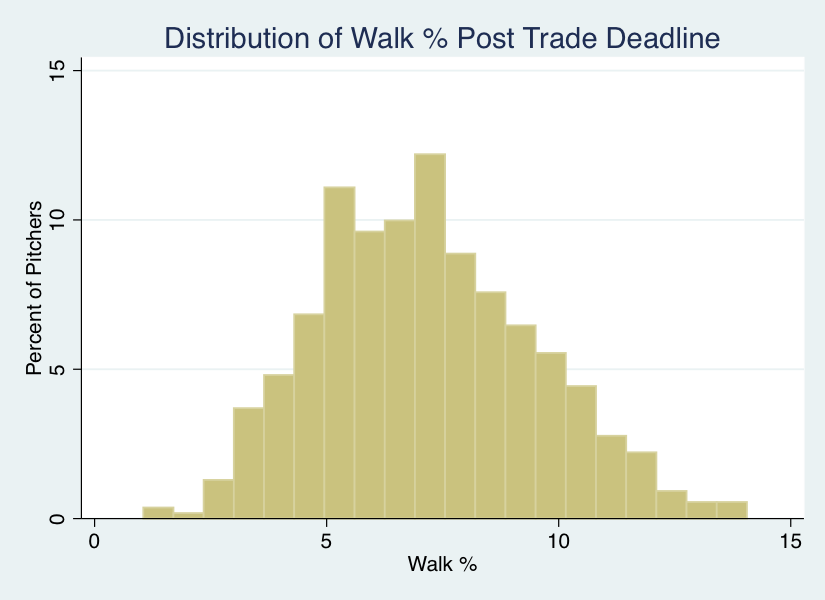
To compare of how pitchers performed before and after the trading deadline, I had to drop pitchers who didn’t face enough batters after the deadline. We should see what statisticians call a survival bias in the distribution I provided. Pitchers who walked at least 10 percent of opposing batters should be much more likely to get dropped from the sample unless they improve their performance enough to keep their jobs. The high walk rate pitchers who were able to stay in the rotation did cut their walk rate from 10.97 percent to 9.97 percent. This difference is statistically significant at the 0.001 level. The other pitchers in my database, as an aggregate group, did not show improvement. However, the high walk rate pitchers didn’t get close to the 7.16 percent average walk rate for all pitchers in my database.
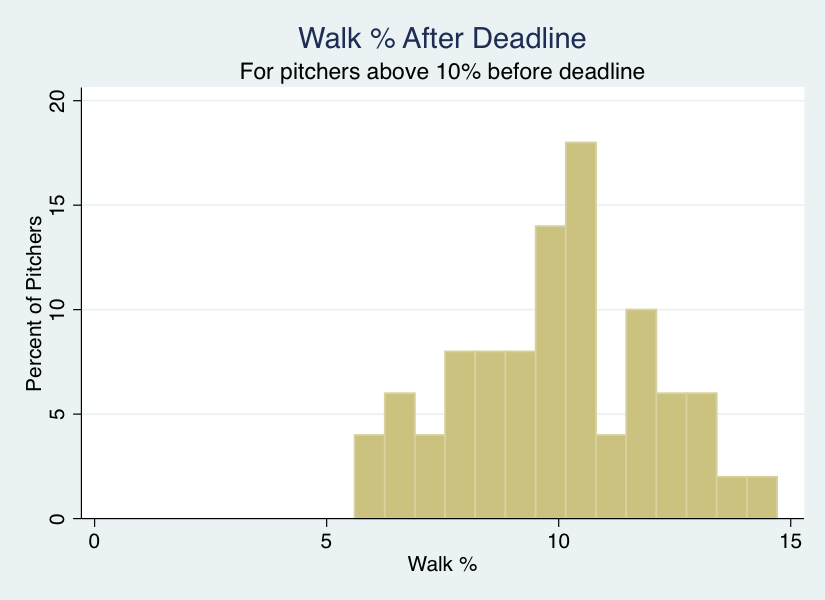
It’s hard to know what part of this improvement is statistical regression to the mean after an unlucky start, what part is pitchers making mechanical changes to keep their jobs, and what part is teams replacing erratic pitchers. What scares me is that the survival bias isn’t stronger. A majority of the pitchers who had a walk rate over 10 percent and kept their spot in the rotation after the trade deadline kept walking one out of every 10 batters over the break! Gio Gonzalez, Francisco Liriano and C.J. Wilson are repeat offenders. Here is the overall distribution of walk rates after the trading deadline for pitchers who walked at least 10 percent of batters before the deadline.
It’s hard to know where Logan Verrett will fall in this distribution if he gets to keep his job as the Mets fifth starter. Walk rates are the second most consistent statistic for pitchers on a year-to-year basis, according to Benjamin Baumer and Andrew Zimbalist’s “The Sabermetric Revolution.” This is also true on a pre-deadline to post-deadline basis. Since my post deadline sample size is smaller (150 batters faced vs. their 250 minimum for the season), the correlation drops from 0.629 between seasons to 0.570 within a season. This suggests that overall, the pre- to post- deadline comparisons aren’t bad.
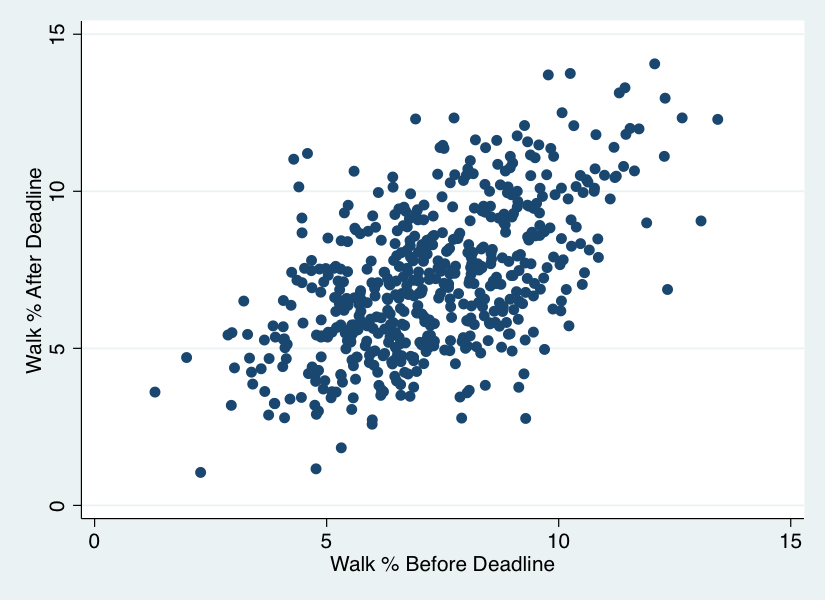
For pitchers who walked at least 10 percent of batters before the deadline, the correlation in walk rates drops to 0.4290. I interpret this as a sign that improvement is far from universal. A few pitchers make major improvements. Most of them make minor improvements. In a few cases, pitchers walk rates actually get worse and they don’t get replaced. It’s important to note that only 50 pitchers met my criteria for high walks and stayed in the rotation during the five years I’m looking at – some teams won’t give second chances.
Now let’s take a look at strikeouts. Baumer and Zimbalist found strikeout rates are the most consistent statistic from one season to the next, with a correlation of 0.759. This is also true when comparing pitchers’ performance before and after the trade deadline. I found a correlation of 0.698 despite the smaller post-deadline sample size.
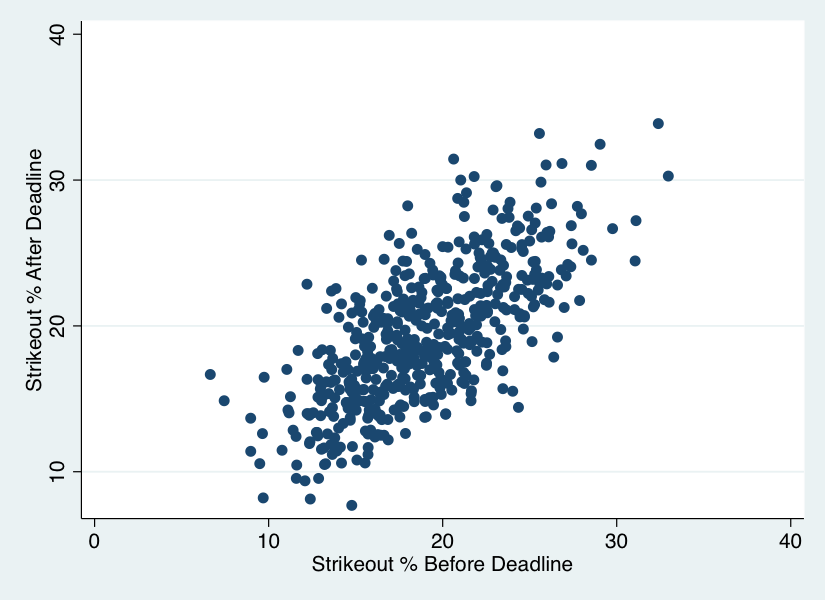
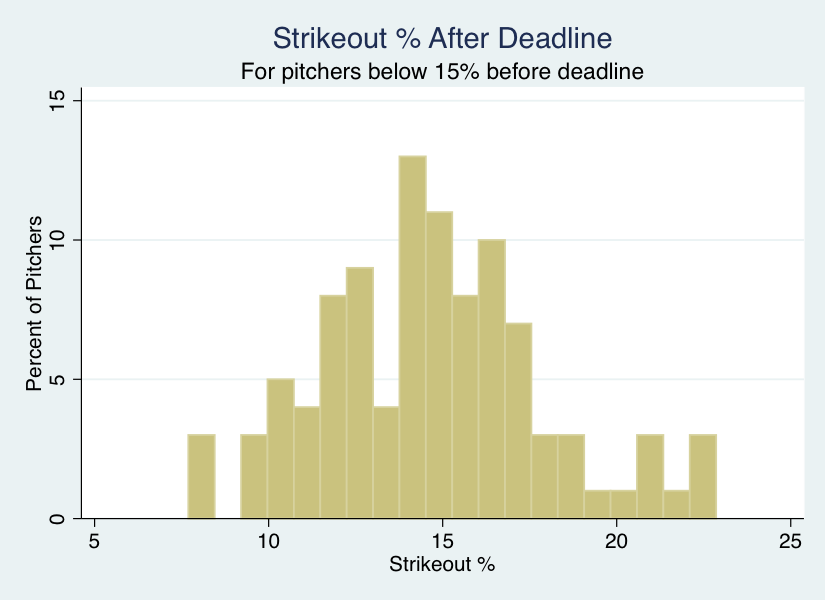
However, I found something very unusual with pitchers who struck out less than 15 percent of opposing batters before the deadline. The 100 pitchers who met this criteria had a pre-deadline / post-deadline correlation of only 0.226. We might expect lower correlations on extreme ends of the distribution as some unlucky pitchers regress to the mean while the least talented pitchers keep low strikeout rates. However, the top 100 pitchers in pre-deadline strikeout rates had a correlation of 0.409. There appears to be something peculiar and unpredictable about pitchers who have low strikeout rates at this point in the season.
One way to try and explain this is through the sad tale of former Met Mike Pelfrey. Big Pelf always confounded fans. How can a young pitcher someone who consistently throws 93-94 strike so few hitters out? According to Brooks Baseball, Pelfrey tinkered with his pitching repertoire several times during his Mets career. In 2010 he added a splitter as his primary out pitch. He wasn’t striking hitters out, so he moved more exclusively to his sinker instead of a four seam fastball and tried to induce ground balls. In 2011 he went back to the slider more and threw fewer fastballs of either the two or four seam variety.
Pelfrey is among the low strikeout rate hitters in my database for both 2010 and 2011. As we might expect, he tinkered with his offerings to try and be more effective. However, his strikeout rates actually got worse after the trading deadline each of his last two full seasons in New York. Adding or subtracting pitches may be a higher variance strategy than tweaking mechanics to improve command.
There also seem to be high command pitchers who can consistently improve a bit on their low strikeout rates towards the end of the season. Mark Buehrle, Doug Fister and Rick Porcello are on this list three times each from 2010-2014. Bartolo Colon improved his strikeout rate from 13.33 percent before the deadline to 21.2 percent after the deadline with minimal changes to his pitch selection at age 40. Command pitchers may be able to take advantage of more established scouting reports on players and umpires at the end of the season. It’s hard to see Logan Verrett–one of the wildest pitchers in baseball this year–using pinpoint command to take advantage of scouting reports.
Based on this analysis, I’d switch to Jon Niese immediately. The Pirates dumped Niese in part because of his extremely high home run rate. However, home run rates only have a 0.206 correlation between pre-deadline and post deadline. There’s a reasonable chance that Niese can keep the ball in the ballpark as well as Verrett down the stretch. There’s almost no chance that Verrett can lower his walk rate to Niese’s 7.8 percent. I’m not saying Niese is a great option – his strikeout rate is only slightly better – but he’s probably the better of the two.
Photo Credit: Rick Osentoski-USA TODAY Sports