During the 2016 season, the New York Mets scored only 671 runs, a mark that was 25th in the league. However, by only allowing 617 runs, they managed to make the one-game Wild Card playoff game. A lot of this is thanks to the fact that within their division were the Miami Marlins, Atlanta Braves, and Philadelphia Philles–who ranked 27th, 29th, and 30th in runs scored, respectively. A main issue for the Mets–something the fans and the SNY broadcast would frequently bring up–was their inability to get hits with runners in scoring position. The Mets in 2016 did finish with a league-worst .225 batting average with runners in scoring position, but despite this they still managed to score just enough runs to make the playoffs. So the question is: how exactly did they do this?
The New York Mets in 2016 suffered a generally unlucky year at the plate between their second-to-worst league BABIP of .282 and that batting average with runners in scoring position mentioned above. But where the Mets surprisingly were able to be successful was in their ability to score runs via home run.
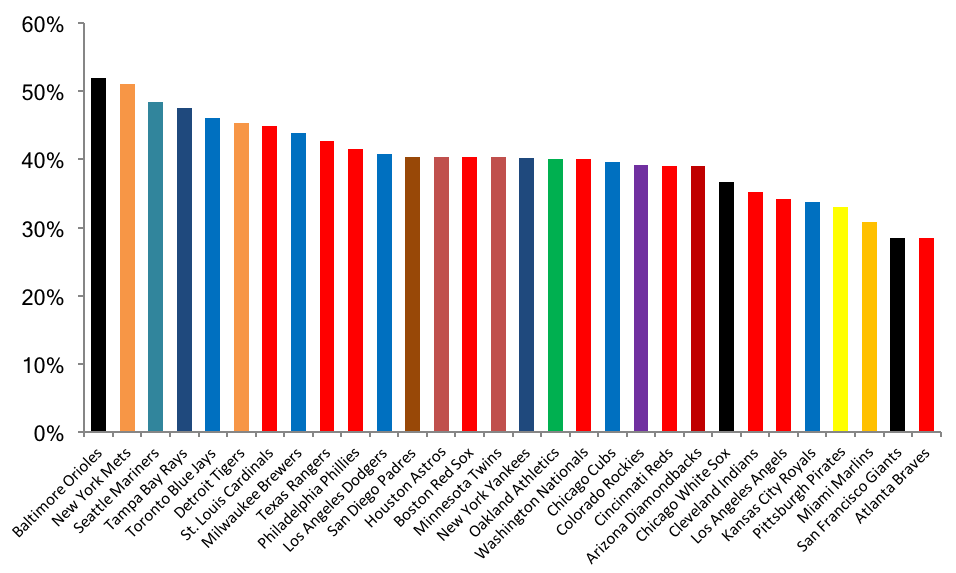
During the 2016 season, the league average team scored 40.2 percent of their runs via the home run. However, the Mets, as seen in the chart below, finished second in the league at 51.1 percent. That’s just below the high-slugging Baltimore Orioles who managed to score 51.9 percent of their total runs via the home run. (Scoring runs via home run is defined as any run that is ultimately scored on a home run, either as the batter or a runner on base at which the home run was hit.) Look at this chart … it is clear that the New York Mets and Baltimore Orioles were largely over the league average. Whereas other teams were able to manufacture generally 60 percent of their runs in other ways, only the Mets and Orioles scored over half of the runs via dinger.
Percentage of Runs Scored Via Home Run
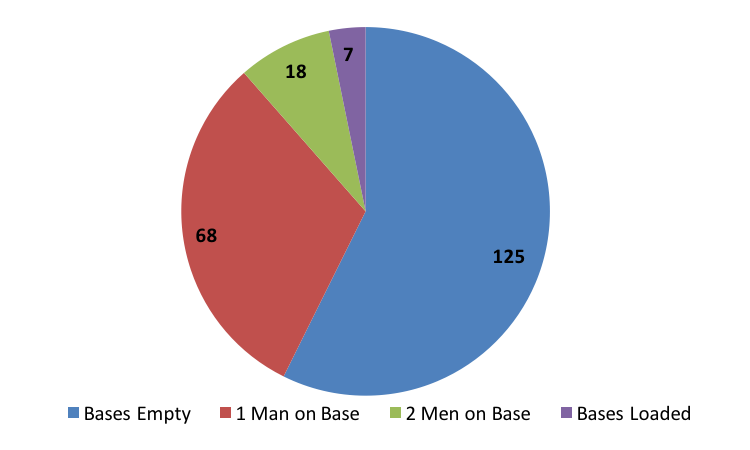
Further interestingly enough is to breakdown the manner in which the Mets hit home runs. They finished eighth in the league in solo shots, second in two-run home runs, 20th in the league in three-run homers, but finished tied for the league lead in grand slams with seven. As seen in the pie chart below, the Mets hit over half of their home runs via the solo shot (bases empty) but also weren’t picky when hitting home runs.
Distribution of New York Mets Home Runs
Although the Mets of 2016 were able to manufacture enough runs to make the Wild Card game, this success is not sustainable. Note that the other team that snuck into and was eliminated in the first game of the playoffs was the Baltimore Orioles–the one team to score more runs than the Mets via homer during the 2016 season. We will see if the 2017 New York Mets can find a way to manufacture more runs and reverse their bad luck with their BABIP or if they will have to rely heavily on the long ball once again to try to make the playoffs.
Photo Credit: Derik Hamilton-USA TODAY Sports


