All year long it was painful to watch the Mets with runners in scoring position. The good news is study after study has found that success in clutch situations has no year-to-year correlation. I’m not saying the Mets will automatically be great with runners in scoring position next season. I’m saying 2016’s struggles shouldn’t affect the 2017 team in any way, even if the entire lineup returns.
So what’s the best way to make sense of the Mets struggles in 2016? Was it a fluke? Extreme bad luck? Did we focus on the abysmal .226 batting average with runners in scoring position to distract from the Mets’ overall .246 batting average, which was the sixth-worst in baseball? Let’s say a hitter’s performance in the clutch is batting skill + clutch skill + dumb luck. Most of the sabermetric community has focused on the relative weight of clutch skill and dumb luck. We don’t have a lot of guides explaining the relative importance of dumb luck vs. batting skill over the course of a season. We can identify extreme cases like Curtis Granderson’s .152/.277/.200 slash line and say he really struggled with runners in scoring position. But how often does a player hit 50 points better or 50 points worse in these clutch situations? What’s the range of power fluctuation?
Part of why statisticians avoid these types of questions is because we know the answer changes. The more we observe a hitter, the more unusually good or bad luck in clutch situations should balance out. Over enough plate appearances hitter’s performance should reflect their true skill. It’s part of what statisticians call the central limit theorem. This principle is a big part of why baseball is much easier to analyze with statistics than football is.
To help explain this I created a simulation in Stata. With real players we always have to guess what a player’s “true” talent is and how much of their performance is based on luck. In a simulation I can decide the hitter’s true talent is a .300 batting average. I told Stata to roll a 10-sided die 10000 times, then record a hit if the die roll was a 1, 2, or 3. If you know Stata, you know the random number generator isn’t 100 percent random, and sequences can be reproduced.
In honor of the 2016 Mets I chose a seed “20161” for my first simulation. This batter started off a lot like the Mets with runners in scoring position, rolling an 8. No hit. At this point the batter’s clutch performance is 0. After 10 plate appearances, my simulated hitter doesn’t have a hit. This looks sadly familiar. Let’s not assume the random number generator is broken. The chance of getting 10 straight outs is 2.824 percent. After 20 plate appearances, my simulated batter is up to .150. By 100 plate appearances, my simulated hitter is up to .290. This is the regression to the mean we are all used to.
I ran another simulation with the seed “20162.” My second simulated hitter starts out hotter, with hits in eight of its first 20 plate appearances. This kind of hot streak could swing a playoff series! But don’t get attached. By 100 plate appearances, this hitter is batting .190. It only climbs to .215 by 200 plate appearances and .272 by 500 plate appearances. Simulated hitter “20163” was hitting .355 after 200 plate appearances. These were the first three seeds for random numbers I put in to Stata. I could put more in, but you should get a sense of how randomness works.
Remember, all of these hitters were programed to be .300 hitters with some random variation. If we gave them 10000 plate appearances each, they each hit between .301 and .303. Of course, no real life hitter gets 10000 plate appearances with runners in scoring position. Last year only 72 players got 150 or more plate appearances with runners in scoring position. One of the things this simulation shows is that hitters could vary a lot in a small sample.
What I want to do in the rest of this article is try to explain the range of how hitters perform with runners in scoring position in a particular season, compared to their performance in the rest of that season. Runners is scoring position isn’t the most advanced metric for high leverage situations. However, Mets fans heard about the team’s struggles with runners in scoring position almost every day. How much do individual players vary over the course of a season?
To answer this question, I gather data from Retrosheet for every plate appearance from 2010-2015. For now, I am going to focus on the 1,248 times when a player had at least 100 plate appearances with runners in scoring position in a particular season. Let’s start by looking at a player’s batting average with runners in scoring position, as compared to their batting average without runners in scoring position. Since only three Mets had 100 PA with runners in scoring position last season, I lowered the bar to 85 PA. Cabrera, Cespedes, Conforto, Flores, Granderson, Loney, and Walker are represented by red dots.
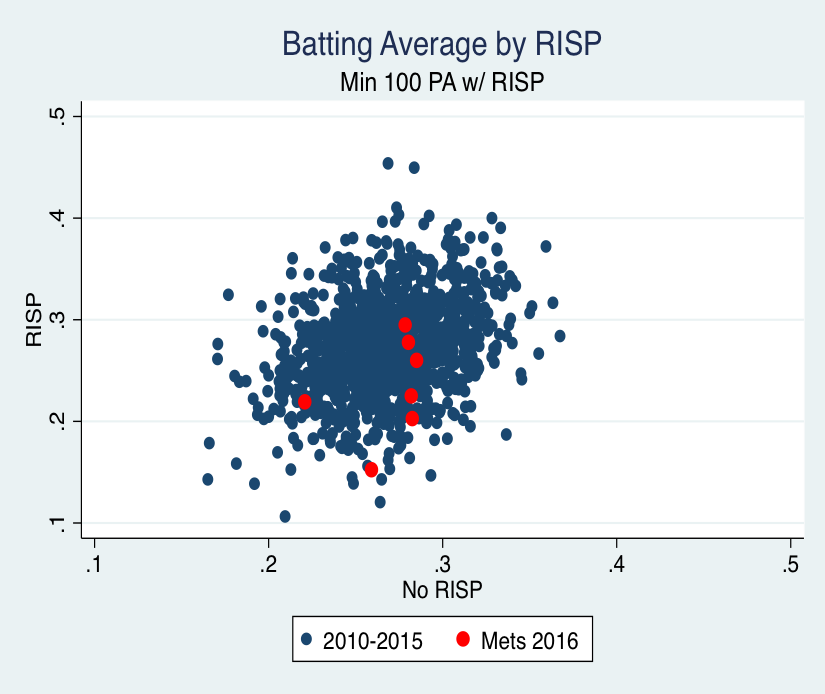
(* – Note: .1 means .100 of batting average, .2 means .200, etc.)
Looks a bit like a blob, doesn’t it? Overall, hitters with a higher batting average continue this in the clutch. However, the correlation between batting average with and without runners in scoring position is only 0.306. If we put this in a regression, knowing a player’s batting average without runners in scoring position only explains 9.3 percent of the variation in batting average with runners in scoring position that season. This shouldn’t be all that surprising if we think about how few at bats players get with runners in scoring position in a particular season. If five hard hit balls get caught by the defense instead of falling for hits, that could drop their batting average with runners in scoring position by 40 to 50 points.
Another way to visualize this is to create a new variable that measures a hitter’s performance with runners in scoring position minus their performance with no runners in scoring position. Positive values mean players do better in these clutch situations. Negative values mean they do worse. If clutch performance is largely based on luck, we should see a bell curve. Random fluctuations will more or less balance out for most players, but we should still see some extreme luck in 100 to 150 plate appearances.
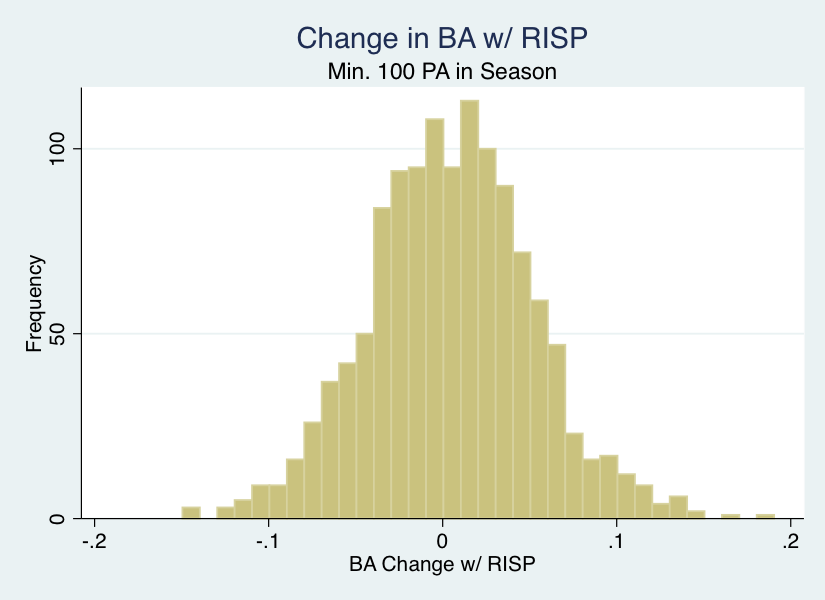 ( * – Note: -0.1 means a hitter’s batting average was .100 lower with RISP, 0.1 means .100 higher, etc.)
This looks like a bell curve, except the most common situation is for hitters to slightly improve their batting average with runners in scoring position. Some of this could be a survivor bias: below average hitters are unlikely to get 100 or more plate appearances with runners in scoring position. I think the best explanation for this is that defenses either play straight up or play in to cut off ground balls instead of overshifting to one side to deny base hits. BABIP goes up by 13.6 points with runners in scoring position, while batting average only went up five points.
I was surprised by how common it was for players to hit considerably better or worse with runners in scoring position. Out of the 1,251 players in my database, 148 of them hit at least 50 points worse with runners in scoring position. 201 players hit at least 50 points better with runners in scoring position. Put together, that’s 27.9 percent of all qualified players whose batting average shifts by at least 50 points with runners in scoring position.
Unfortunately the Mets had three players with sizable declines with runners on base: fan favorite Wilmer Flores (-57), punching bag James Loney (-80), and poor Curtis Granderson (-107). Drops as big an Loney or Granderson are incredibly rare. Granderson’s decline was the 12th biggest in the last six years. To make things worse, only one Met hit better with runners in scoring position:
| Met | BA Change |
| Cabrera | -0.025 |
| Cespedes | -0.003 |
| Conforto | -0.002 |
| Flores | -0.057 |
| Granderson | -0.107 |
| Loney | -0.080 |
| Walker | +0.016 |
Sandy Alderson built the Mets to be a power hitting team and hopefully draw a lot of walks. There is some sound reasoning behind this. Batting average tends to fluctuate more from year-to-year than other stats. We can take a look at what happens to power hitting with runners in scoring position. To try and separate out the Mets’ meager batting average, I used isolated power:
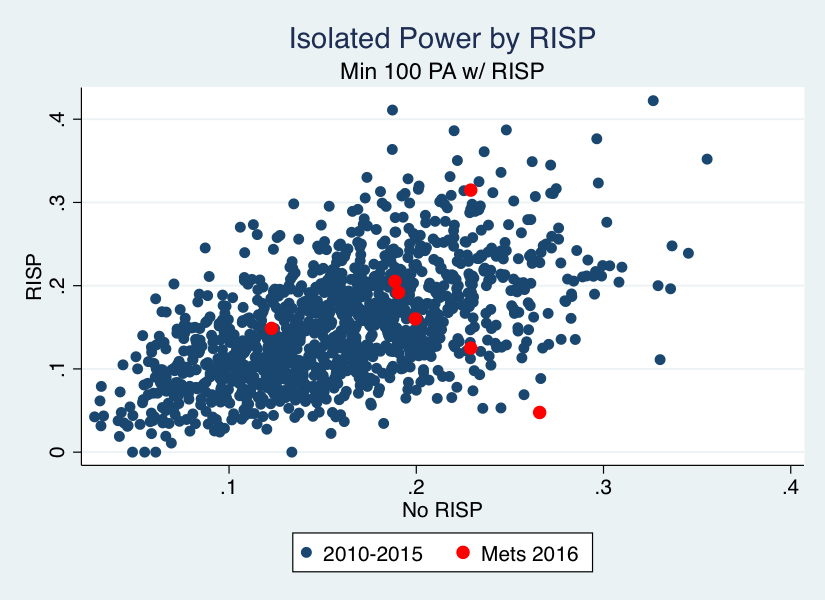
People talked about the Mets’ dependence on home runs all season as if home runs suddenly don’t work with runners in scoring position and teams need a new approach. This is a bit absurd once you think about sabermetric research. Isolated power tends to carry over more than batting average does from year-to-year. ISO also carries over more from batting with no one in scoring position to runners in scoring position. The correlation is 0.576 for all hitters in my database. You may notice a few Met outliers in this graph. Cespedes’ isolated power was 86 points higher with runners on base, while Granderson’s was 218 points lower!
It’s harder to make sense of changes in isolated power in particular game situations. Power shouldn’t evaporate as much as batting average can in clutch situations. On the other hand, there is a much wider range of isolated power in the big leagues. The Marlins started Adeiny Hechavarria all season despite his league low .075 ISO. No major league team would keep a hitter in the majors if their batting average was this low. This leads us to a bit of a paradox. Even though isolated power is more consistent from one situation to the next, any variation from a player’s normal skill level will have a larger number attached to it:
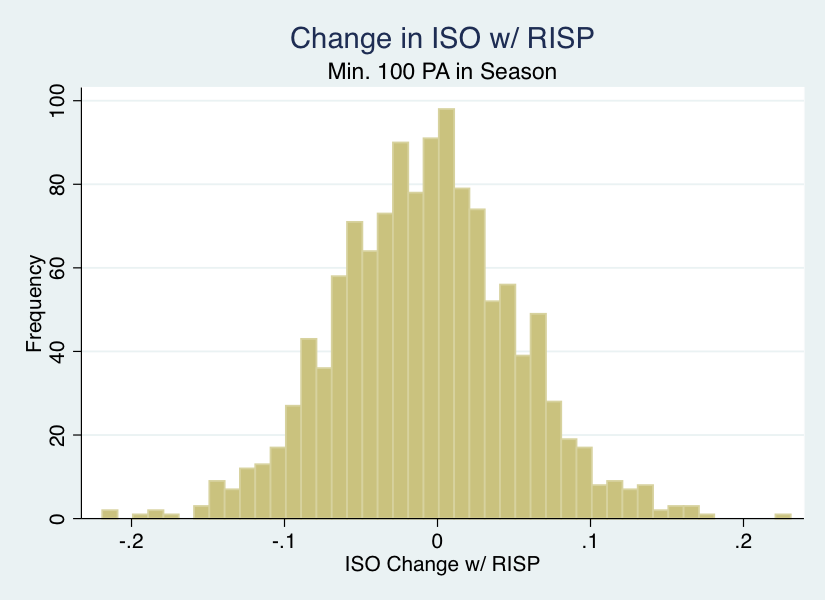
Remember how batting average went up 5 points with runners in scoring position? On average, ISO drops by 7.5 points. There may be a very slight tendency for hitters to emphasize RBI singles. Large drops are more common than large increases. Because the range of isolated power is greater, 39.65 percent of the players in by database had an ISO change of at least 50 points with runners in scoring position. 8.8 percent of players had an ISO change of at least 100 points. A few home runs at the right time can be a major boost!
Curtis Granderson showed us the limit of how far a player can slide in key at bats. He hit 31 home runs, but only one with runners in scoring position. His ISO went from 0.266 (excellent) with no runner in scoring position to 0.048 (worst in the league) with runners in scoring position. There’s no comparison to his shrinking power and contact over a full season in my database. The closest comparison I could find is Justin Morneau in 2010. With no one on base he drove over 20 percent of fly balls out of the ballpark, but he only hit one homer in 108 plate appearances with runners in scoring position. Granderson showed the same tendencies. It’s hard to extrapolate a precedent from Morneau. He missed most of 2011 with a pinched nerve and then more concussion-like symptoms and he hasn’t been the same player since.
The one thing I feel confident saying is Granderson’s epic struggles and Cespedes’ power surge with runners in scoring position don’t tell us much of anything for 2017. I checked my database for the 716 players who had at least 100 plate appearances with runners in scoring position. Good or bad luck in one year has minimal correlation with how they did the next year:
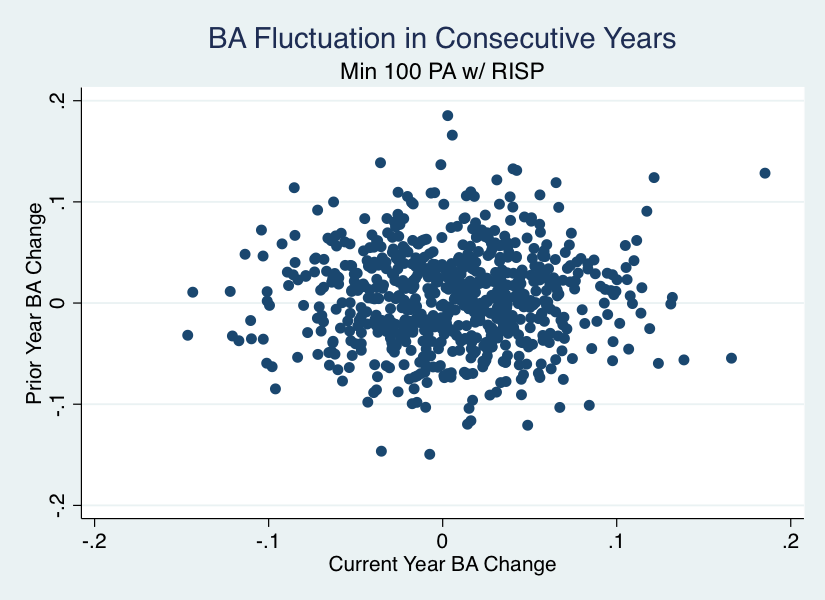
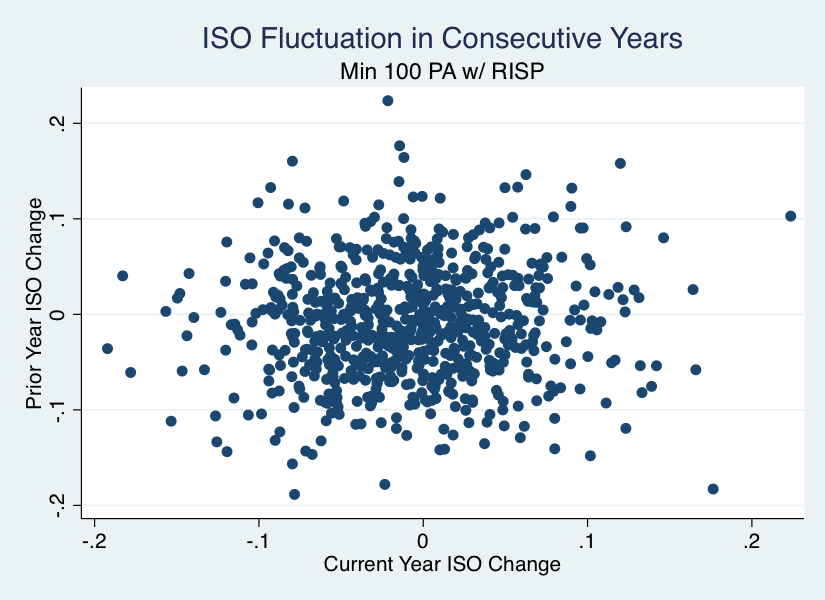
Granderson may not hit as well in 2017 as he did in 2016, but at least we know he probably won’t have the same terrible luck again.
Photo Credit: Derik Hamilton-USA TODAY Sports