After the 2010 season, Jeff Zimmerman posted a series of articles on FanGraphs using regression models to try and predict the probability that a starting pitcher would get injured. It makes a lot of sense that he’d focus on pitchers. After all, the saying is “pitchers break.” Yet for the 2016 Mets, “everyone breaks” may be more appropriate. Every Opening Day starter except Curtis Granderson and Michael Conforto spent time on the disabled list. Can we predict how likely hitters are to get injured in 2017?
To try and answer this question I combined injury data from Baseball Prospectus’ transaction tracker with Retrosheet’s play-by-play data from 2010-2016. I’m going to do a lot with this data set, but I will start with the yes/no question of whether someone goes on the disabled list because it is the easiest to answer. Zimmerman used a logistic regression model, which is specifically designed for outcomes that either occur or do not occur. I’ll do the same, and explain a few of the most important technical details as we go, but save as much of the #gorymath specifics for the footnotes at the end as I can.
Zimmerman’s model for pitchers, based on 2002-2010 data, is remarkably straightforward. He found that the older a starting pitcher is, the more likely that pitcher gets injured. Pitchers who had been injured more of the previous three years are also more likely to get hurt this season. Controlling for these variables, pitchers who made more starts over the last three seasons were more durable than their peers.
I started out trying something similar for hitters. The only change I made was loosening the minimum standards for games played / years of track record to get in the regression model, because higher standards didn’t make the models any more predictive. My minimum is two seasons and at least 100 games played in my dataset. Setting this more inclusive standard makes sure I don’t pre-emptively exclude a player like David Wright because of his career-threatening injuries. My initial results were very different than Zimmerman’s: (full model below)
- Prior years with injury (out of the last two): Increase probability of injury this year around 6.5 percent per prior year with an injury. Logistic regression is based on multiplying the effect of each independent variable instead of adding, so any number like 6.5 percent is a rough estimate.
- Age at midpoint of season: Each additional year of age increases a hitter’s probability of injury by around 0.36 percent. This is much smaller than we’d expect and not close to statistically significant (p = 0.236)
- Games played, last two years: Each additional game played increases a player’s chance of getting injured by 0.048 percent. It’s tiny, but considering the wide range of games played this was still statistically significant at the 0.001 level.
This is when I started backing away from the computer very slowly. Is there a bug somewhere? Did I make some sort of programming error? It’s almost impossible to believe that games played could be a sign of fragility and age would not have a statistically significant impact on the chance of a position player getting injured.
After spending some time getting fresh air and looking away from the computer, I went back to my regression model for hitters. I started by copying Zimmerman’s decisions for pitchers, because it’s important to know if hitters face similar injury risks. However, there are a number of reasons why hitter injuries could be different than pitcher injuries. Starting pitcher injuries are overwhelmingly related to the violence of pitching mechanics and the strain it puts on different parts of the arm. Hitters’ injuries are spread throughout the body. They could be caused by fielding or hitting. The relationship between age and injury could also be different because my data comes from an era when baseball has clamped down on PEDs.
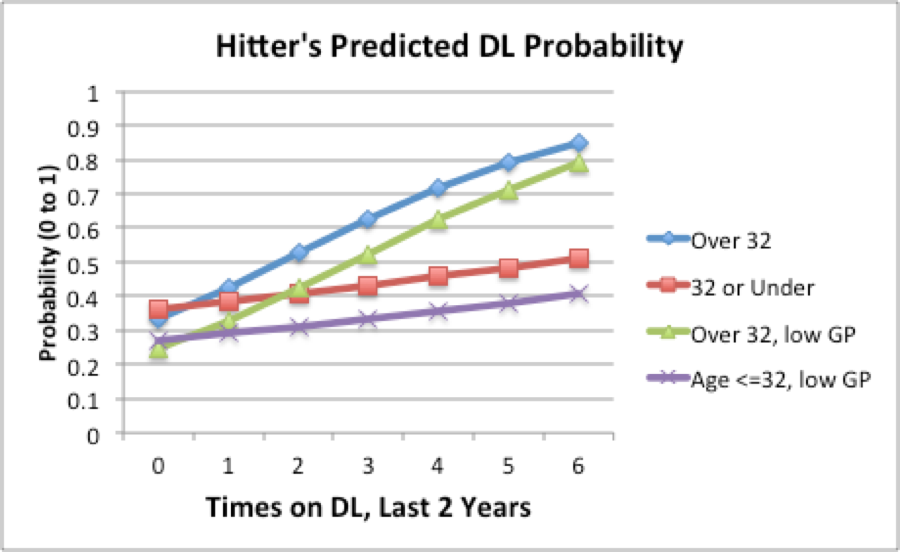
After testing different possibilities for games played, plate appearances, prior injuries and age, the best logistic regression model I came up with for hitters looks considerably different than Zimmerman’s pitchers model. I’ll give the quick explanation of what I did, one graph with all my results, some predictions for the 2017 Mets, then explain in more detail why hitters’ injuries seem to be different than pitchers.
- Injury History: How many times did the player go on the DL in the last two years? Players who keep going on and off the DL are more likely to go back on the DL. (I tried other measures like days on DL.)
- Age: Is the player over 32 in the current season?
- Injures & Age: An “interaction term”–something I can use to test whether old players coming off injures are even more susceptible to re-injury than younger players. The whole injury risk is much greater than the sum of the parts.
- Games Played: Did the player appear in at least 139 MLB games the past two seasons combined? After hitting this point, any increase in durability is largely balanced out by additional wear and tear plus added risk of freak injury.
Because age and games played are yes/no variables, I can put all the possible outcomes on one graph. (The equation is below.) I measured probabilities from 0 to 1; multiply by 100 to get the percentage chance of injury.
Based on these results, I computed predictions for all the Mets who could receive considerable playing time in 2017:
| Player | Prior Injuries | Over 32? | % Chance of 2017 Injury |
| Jay Bruce | 0 | N | 35.90% |
| Asdrubal Cabrera | 2 | N | 40.70% |
| Yoenis Cespedes | 1 | N | 38.30% |
| Michael Conforto | 0 | N | 35.90% |
| Travis d’Arnaud | 3 | N | 43.20% |
| Lucas Duda | 2 | N | 40.70% |
| Wilmer Flores | 1 | N | 38.30% |
| Curtis Granderson | 0 | Y | 33.10% |
| Juan Lagares | 2 | N | 40.70% |
| Jose Reyes | 2 | Y | 52.80% |
| Neil Walker | 1 | N | 38.30% |
| David Wright | 2 | Y | 42.20% |
A number of things in this regression model are counter-intuitive. I think the best way to explain what’s going on is by using various Mets as examples:
Jose Reyes – Old and Injury Prone
My regression model suggests it’s more likely than not that Jose Reyes will get injured again in 2017. I doubt this is a surprise to Mets fans. He strained his oblique last year and cracked a rib in 2015. I cut off prior injuries after two years, so I’m not factoring in his major ankle injury in 2013 or his recurring hamstring problems. Reyes has always been at least somewhat injury-prone, but the risk has mounted as he’s gotten older. The big contribution of my regression model is that we shouldn’t just add age risk plus prior injury risk to determine the total risk of injury. Each additional prior injury had four times the effect on a player’s likelihood of getting injured this season if that player was over 32.
Curtis Granderson – Old But Low Risk?
At 35 years old, Granderson is the oldest position player on the Mets’ roster. He’s also the least likely to get injured according to my regression model. Age and durability don’t really go together! That’s a basic tenet of qualitative and quantitative approaches. So what’s going on here? First of all, there’s a difference between needing more scheduled days of rest versus getting injured and going on the disabled list. Even if Granderson stays healthy, we’d expect him to need more rest at this point. I double-checked my data with a separate regression model for games played and it works like we’d expect: position players play fewer games as they get older and they play more games if they’ve been regulars the last two years.3
If an older player has been able to avoid injury, they have probably learned something about how to keep their body from wearing down. They also have some good luck, and a team that knows when to give rest. Putting all these things together, older players with no injuries in the past two seasons may be a little less likely to get injured than their younger peers. This difference is not close to statistically significant (p = 0.45), but it’s still important to keep in the regression model.4
David Wright – Shouldn’t he be 100%?
These predictions don’t include spring training injuries unless someone starts on the disabled list.
I’m pulling out David Wright’s prediction because it shows just how unusual his medical condition is among professional baseball players. Wright is suffering from a degenerative spinal condition that can lead to other major symptoms, like his recent shoulder injury. My regression model doesn’t separate different kinds of injuries. That’s why Lucas Duda and Asdrubal Cabrera have the same injury risk. I could eventually separate back injuries from knee tendons. However, there’s no way I can separate spinal stenosis from its symptoms. David Wright will be a tragic outlier in any regression model because there aren’t enough cases of degenerative conditions to make them a separate variable.
Lucas Duda & Asdrubal Cabrera – Didn’t One of Them Miss More Time?
Duda missed most of the season with his back injury, while Asdrubal Cabrera only missed 15 days. They both suffered minor injuries in 2015. If Duda missed more time this year, doesn’t it seem like he should be a bigger injury risk this year? I was a bit surprised to see that total DL trips was a better predictor than days on the DL. I think this is a big difference between hitters and pitchers. If pitchers have a major injury, it’s probably their elbow or shoulder. If they return to baseball, they will continue to place far more stress on those body parts than anything else. Since hitters distribute stress a bit more evenly throughout the body, they won’t always be straining the body part that was severely injured last year.
Travis d’Arnaud – Injury Magnet?
The Mets’ young catcher fractured a finger on his throwing hand in April 2015. He returned on June 10 but was back to the DL two weeks later, this time with a sprained left elbow. d’Arnaud missed almost two months in 2016 with a strained right rotator cuff. When Zimmerman studied pitchers he capped them at one injury per year, because all of a pitcher’s arm injuries tend to be related to each other. Hitters can keep having relatively unrelated injuries, like d’Arnaud has the last two years. That’s why total trips to the DL was a better predictor than the number of years with an injury.
Eric Campbell – A “Special” Way to Avoid Injury
Regular BP Mets readers probably have celebrated when they saw the Mets let Eric Campbell go after consecutive below-replacement seasons. If Campbell was still in the majors, my model would give him just a 27 percent chance of getting injured this year. Is he really more durable than any active Met? I doubt it. The reason Campbell’s injury risk would be so low is because he wasn’t good enough to get off the bench! Players who were in the bottom 25 percent of games played the past two seasons are predicted to get injured around 34 percent less often this season than their more active peers, controlling for other variables.5
There seems to be a certain baseline level of injury risk in playing baseball, just like there is for any other sport. Playing every day shows durability and the ability to play through pain. However it also exposes players to more risk, between straining muscles, collisions and misplaced 95 mph fastballs. When it comes to predicting whether or not a position player gets injured, these factors largely balance out. We need to see if players who proved their durability in the past will recover more quickly if they get hurt, but this requires a much more complex statistical model. Check back next week for an explanation of why it’s so hard to model.
Here’s your #gorymath footnotes:
1: Logistic regression tries to predict the probability of an event occurring – in this case an injury – by putting every independent variable in to the equation Pr(injury) = 1 / (1 + e ^ (-z)).
- e is the mathematical constant 2.718
- z is a full algebraic equation, like we’d see in a more basic regression model.
- z when copying Zimmerman’s independent variables = .0156 * age this season + .2814 * prior years w/ DL stint + .0021 * games played the last two years – 1.623
- Positive regression coefficients for the equation z mean injury is more likely.
- Logistic regression uses a different formula from more basic regression models to ensure all outcomes are between 0 and 1.
2: Here is the better-fitting logistic regression model I used:
- Pr(injury) = 1 / (1 + e ^ (-z)).
- In my model, z = .1017 * DL visits the past 2 years + .3059 * DL visits the past 2 years if the player is over 32 years old – .126 if the player is over 32 years old – .417 if the player played under 139 games the last two years – .5785
- Writing out the equation gets much simpler if we write out two separate equations based on player age:
- 32 and under: z = .1017 * DL visits the past 2 years – .417 if the player played under 139 games the last two years – .5785
- 33 and older: z = .4077 * DL visits the past 2 years – .126 * 1 – .417 if the player played under 139 games the last two years – .5785
3: The bare bones OLS regression model I used is games played = .3253 * games played the last two seasons – 2.731 * age this year + 4.449 * injuries the past two seasons. It’s pretty straightforward except for that positive coefficient for injuries. I suspect this is a survivor bias. Players who can’t come back from injury or don’t get a chance to will be dropped from the model. (We can debate whether a Poisson model is more appropriate than OLS but the results are similar enough for a footnote.)
4: Every independent variable affects our predicted outcome, even if it is not statistically significant. There’s a strong reason to keep some variable to represent age in the regression model, even if none of them are statistically significant. Our prior knowledge about baseball says age could affect injury risk. We learn more by keeping it in the model. This is particularly important when we have an interaction term. One of the common mistakes people make when learning this method is including the interaction term but forgetting the baseline variable.
5: I can’t directly test whether players who rarely played in the past stayed relatively inactive for the season that counts for the dependent variable. If I put something like games played this season in the model, many players are either playing or injured. To test whether players who rarely played in the past tend to stay on the bench, I did a t-test of whether these players get fewer plate appearances per game they play in this season. If anything, this measure should be biased towards similarity, since regulars fighting through injury may be relegated to pinch hitting duty. As a group, players who were relatively inactive in the past averaged significantly fewer plate appearances per game (p = 0.001).
Photo Credit: Steve Mitchell-USA TODAY Sports
1 comment on “Statistically Projecting Mets Position Player Injuries for 2017 (Part 1)”
Comments are closed.