When the Mets were in the World Series last year against the Royals, Noah Syndergaard was merely their Game 3 starter. As Ben Lindbergh and Sam Miller noted on the “Effectively Wild” podcast, that fact is incredible to consider at this point (with all due respect to Matt Harvey and Jacob deGrom); “Thor” has certainly brought the thunder early in 2016.
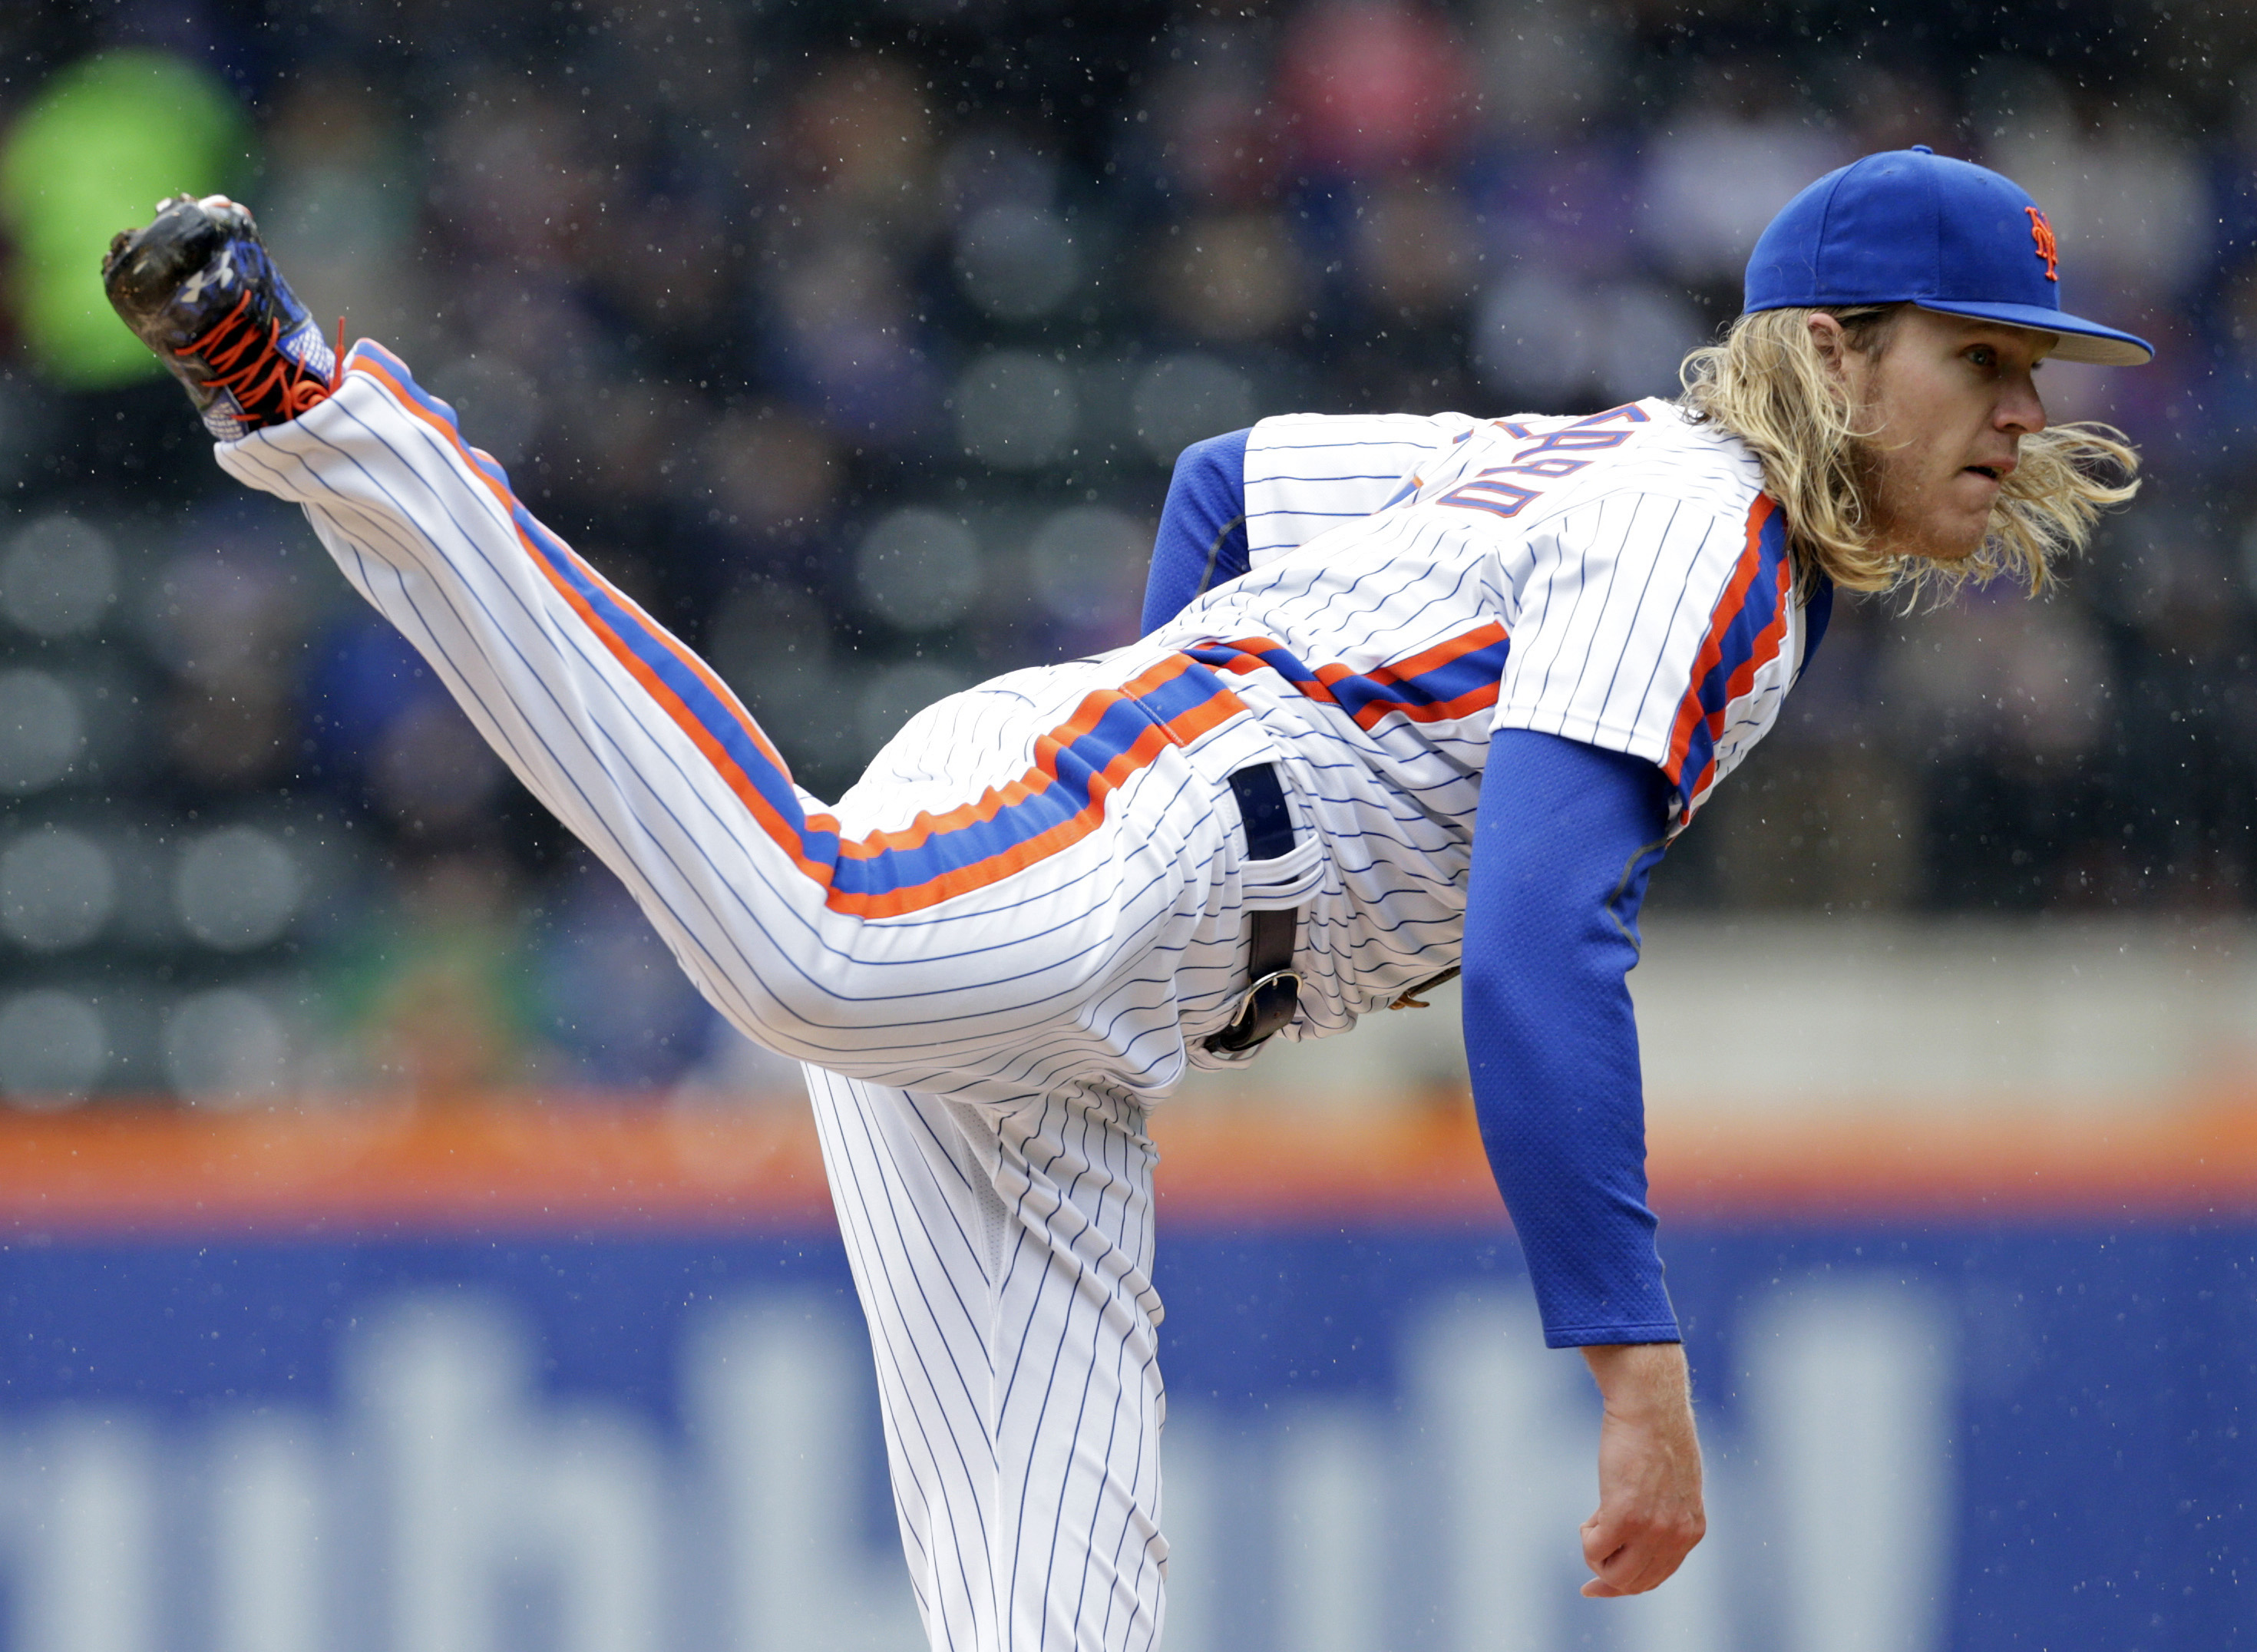
The flamethrowing righty began the 2016 season with a flourish, overpowering the National League in April with 38 strikeouts in just four starts and 26 and two-thirds innings. He has yet to allow a home run and his 12.8 strikeouts per nine innings are the best in the NL, trailing only David Price among all starters. By Baseball Prospectus measures, he leads all starters with a 1.00 FIP and is tied with Clayton Kershaw for the NL lead with a 65 cFIP (again behind only Price for the MLB lead). Syndergaard is in tremendous company and seems to be the most exciting starter on a pitching staff chock full of talent.
Now that Syndergaard is done pitching in April, fans can only wonder what the rest of the campaign could offer. He is probably not going to be quite this spectacular for the entire season and could very well simply be in the middle of a hot streak. After all, Syndergaard is just one of several Mets in franchise history who dominated in April.
Not all arms are alike and April trends vary from year to year, but it can still be revealing to look back on those previous Aprils to see how the pitchers fared for the rest of the season. Using the Baseball-Reference Play Index, I searched all Aprils in Mets history for pitchers who owned the month as much as Syndergaard, which means a sub-2.00 ERA and a sub-1.000 WHIP in at least four starts.
| Player | Year | April | ||||||||||||
| G | GS | ERA | WHIP | IP | H | R | ER | HR | BB | SO | SO9 | BB9 | ||
| Tom Seaver | 1968 | 4 | 4 | 1.59 | 0.794 | 34 | 26 | 9 | 6 | 1 | 1 | 17 | 4.5 | 0.3 |
| Jerry Koosman | 1968 | 4 | 4 | 1.04 | 0.923 | 34.2 | 23 | 5 | 4 | 1 | 9 | 27 | 7.0 | 2.4 |
| Tom Seaver | 1970 | 5 | 5 | 1.90 | 0.914 | 42.2 | 34 | 9 | 9 | 2 | 5 | 43 | 9.1 | 1.1 |
| Tom Seaver | 1971 | 5 | 5 | 1.37 | 0.839 | 39.1 | 24 | 6 | 6 | 0 | 9 | 45 | 10.3 | 2.1 |
| Tom Seaver | 1973 | 5 | 5 | 1.12 | 0.793 | 40.1 | 21 | 5 | 5 | 5 | 11 | 30 | 6.7 | 2.5 |
| Jerry Koosman | 1973 | 4 | 4 | 1.06 | 0.853 | 34 | 22 | 6 | 4 | 1 | 7 | 14 | 3.7 | 1.9 |
| Tom Seaver | 1976 | 5 | 5 | 1.89 | 0.947 | 38 | 25 | 8 | 8 | 1 | 11 | 35 | 8.3 | 2.6 |
| Tom Seaver | 1977 | 5 | 5 | 1.52 | 0.871 | 41.1 | 27 | 7 | 7 | 2 | 9 | 32 | 7.0 | 2.0 |
| Craig Swan | 1978 | 4 | 4 | 1.24 | 0.759 | 29 | 15 | 6 | 4 | 1 | 7 | 19 | 5.9 | 2.2 |
| Dwight Gooden | 1985 | 5 | 5 | 1.38 | 0.795 | 39 | 21 | 7 | 6 | 2 | 10 | 34 | 7.8 | 2.3 |
| Dwight Gooden | 1986 | 5 | 5 | 1.26 | 0.791 | 43 | 28 | 7 | 6 | 2 | 6 | 32 | 6.7 | 1.3 |
| Frank Viola | 1990 | 4 | 4 | 1.32 | 0.732 | 27.1 | 18 | 4 | 4 | 1 | 2 | 29 | 9.5 | 0.7 |
| Rick Reed | 1997 | 5 | 4 | 1.03 | 0.771 | 35 | 22 | 6 | 4 | 2 | 5 | 22 | 5.7 | 1.3 |
| Al Leiter | 2002 | 6 | 6 | 0.92 | 0.821 | 39 | 23 | 12 | 4 | 1 | 9 | 32 | 7.4 | 2.1 |
| Tom Glavine | 2004 | 5 | 5 | 1.64 | 0.970 | 33 | 25 | 8 | 6 | 1 | 7 | 11 | 3.0 | 1.9 |
| Johan Santana | 2009 | 5 | 5 | 1.10 | 0.949 | 32.2 | 22 | 6 | 4 | 2 | 9 | 44 | 12.1 | 2.5 |
| Matt Harvey | 2013 | 6 | 6 | 1.56 | 0.818 | 40.1 | 21 | 7 | 7 | 2 | 12 | 46 | 10.3 | 2.7 |
| Noah Syndergaard | 2016 | 4 | 4 | 1.69 | 0.975 | 26.2 | 22 | 5 | 5 | 0 | 4 | 38 | 12.8 | 1.4 |
There were 16 other occasions in Mets history with starters as sharp as Syndergaard in April. None of them struck batters out at a better rate than him, though most recorded better ERAs and WHIPs, even with higher innings totals. Compared to their Aprils, here is how those pitchers performed for the entire season, sorted by ERA. (Bold indicates that the pitcher led the league.)
| Player | Year | Full Season | % Increase | |||||||||||||
| G | GS | ERA | WHIP | IP | H | R | ER | HR | BB | SO | SO9 | BB9 | ERA | WHIP | ||
| Dwight Gooden | 1985 | 35 | 35 | 1.53 | 0.965 | 276.2 | 198 | 51 | 47 | 13 | 69 | 268 | 8.7 | 2.2 | 11% | 21% |
| Tom Seaver | 1971 | 36 | 35 | 1.76 | 0.946 | 286.1 | 210 | 61 | 56 | 18 | 61 | 289 | 9.1 | 1.9 | 28% | 13% |
| Jerry Koosman | 1968 | 35 | 34 | 2.08 | 1.100 | 263.2 | 221 | 72 | 61 | 16 | 69 | 178 | 6.1 | 2.4 | 100% | 19% |
| Tom Seaver | 1973 | 36 | 36 | 2.08 | 0.976 | 290 | 219 | 74 | 67 | 23 | 64 | 251 | 7.8 | 2.0 | 86% | 23% |
| Tom Seaver | 1968 | 36 | 35 | 2.20 | 0.978 | 278 | 224 | 73 | 68 | 15 | 48 | 205 | 6.6 | 1.6 | 38% | 23% |
| Matt Harvey | 2013 | 26 | 26 | 2.27 | 0.931 | 178.1 | 135 | 46 | 45 | 7 | 31 | 191 | 9.6 | 1.6 | 46% | 14% |
| Craig Swan | 1978 | 29 | 28 | 2.43 | 1.071 | 207.1 | 164 | 62 | 56 | 12 | 58 | 125 | 5.4 | 2.5 | 96% | 41% |
| Tom Seaver | 1977 | 33 | 33 | 2.58 | 1.014 | 261.1 | 199 | 78 | 75 | 19 | 66 | 196 | 6.8 | 2.3 | 70% | 16% |
| Tom Seaver | 1976 | 35 | 34 | 2.59 | 1.063 | 271 | 211 | 83 | 78 | 14 | 77 | 235 | 7.8 | 2.6 | 37% | 12% |
| Frank Viola | 1990 | 35 | 35 | 2.67 | 1.150 | 249.2 | 227 | 83 | 74 | 15 | 60 | 182 | 6.6 | 2.2 | 102% | 57% |
| Tom Seaver | 1970 | 37 | 36 | 2.82 | 1.077 | 290.2 | 230 | 103 | 91 | 21 | 83 | 283 | 8.8 | 2.6 | 48% | 18% |
| Dwight Gooden | 1986 | 33 | 33 | 2.84 | 1.108 | 250 | 197 | 92 | 79 | 17 | 80 | 200 | 7.2 | 2.9 | 125% | 40% |
| Jerry Koosman | 1973 | 35 | 35 | 2.84 | 1.179 | 263 | 234 | 93 | 83 | 18 | 76 | 156 | 5.3 | 2.6 | 168% | 38% |
| Rick Reed | 1997 | 33 | 31 | 2.89 | 1.042 | 208.1 | 186 | 76 | 67 | 19 | 31 | 113 | 4.9 | 1.3 | 181% | 35% |
| Johan Santana | 2009 | 25 | 25 | 3.13 | 1.212 | 166.2 | 156 | 67 | 58 | 20 | 46 | 146 | 7.9 | 2.5 | 185% | 28% |
| Al Leiter | 2002 | 33 | 33 | 3.48 | 1.287 | 204.1 | 194 | 99 | 79 | 23 | 69 | 172 | 7.6 | 3.0 | 278% | 57% |
| Tom Glavine | 2004 | 33 | 33 | 3.60 | 1.290 | 212.1 | 204 | 94 | 85 | 20 | 70 | 109 | 4.6 | 3.0 | 120% | 33% |
| Average | 33 | 33 | 2.58 | 1.082 | 244.3 | 201 | 77 | 69 | 17 | 62 | 194 | 7.1 | 2.3 | 101% | 29% | |
It should hardly come as a surprise that Seaver was able to maintain most of that April form throughout his seasons. Hall of Fame talent usually keeps a pitcher on top, whereas lesser pitchers couldn’t keep pace. Gooden’s 1985 campaign is in the conversation for the greatest pitching seasons of the modern era, so “Doc” topping the list is not a shock, either. ERAs averaged a 101% increase, and WHIPs went up by 29%, forecasting a potential Syndergaard season-ending line of a 3.40 ERA and a 1.26 WHIP. (It would make sense to trust in PECOTA’s more mathematically sound 3.04 ERA and 1.09 WHIP rest-of-season projection though.)
Regardless, Syndergaard’s rate stats compare more favorably with the likes of Seaver and Gooden than the others. Harvey’s 2013 would fit in well too … if it didn’t have the asterisk of being somewhat abbreviated thanks to his season-ending Tommy John surgery. The other pitchers were not strikeout artists like Syndergaard, and the lower ERAs unsurprisingly tended to correlate more with high strikeout totals (save for Koosman’s 1968, an anomaly enabled by the Year of the Pitcher’s microscopic statistics). Leiter’s 2002 does not jive with Syndergaard’s 2016 either, as he has consistently walked fewer batters than Leiter typically did. It would probably be asking too much for Syndergaard to match legends like Seaver and Gooden, but since their rates are closest to his, final figures in their general vicinity could be in his future.
Santana in 2009 and Seaver in 1970 likely showed the worst-case scenarios for Syndergaard’s season at this point. Both aces maintained good strikeout rates and control and still had strong campaigns anyway, but their ERAs jumped thanks in part to surrendering at least 20 homers each. Although Syndergaard has yet to surrender a dinger this year, he gave up about a homer per nine innings in 2015. A reckoning will come at some point; it will just be on him to avoid mistakes and, of course, keep baserunners to a minimum.
Syndergaard’s April success has offered some extremely encouraging signs of his evolution as a pitcher. Even if the 23-year-old righty isn’t this dominant for the rest of the season, the successes of these previous April sensations suggest that he is on pace for a truly excellent 2016. The biggest test will be how he reacts to the higher expectations. Thankfully, Syndergaard definitely has the talent to meet the challenge.
Photo Credit: Adam Hunger-USA TODAY Sports
Ha sorry.
I love how he let’s up a homer first day of May. Darn small sample sizes. But if his worst comp is really Seaver’s ’70 it’s gonna be a fun year. Though those stolen bases might be worse than the homers!