In the six-day period from April 18th to the 23rd, the Mets played five games, a pretty typical schedule. During those five games, they hit four pairs of back-to-back home runs, which struck me as extremely atypical. The SNY crew mentioned that it was the first time the Mets had ever accomplished this and although it got a little coverage online, for the most part it was just another random occurrence–one of the fleeting moments in baseball you just can’t predict. For most people, it was enough to note the oddity and move on but for some reason it really piqued my interest. I wanted to know just how rare of a feat it was so I set out to do some research. I didn’t have much luck finding information about the frequency of back-to-back home runs or how often teams had swatted them as prodigiously as the 2016 Mets had that week, so I decided to look into it myself.
My first instinct was to ground myself in some sense of how rare it is to hit back-to-back home runs–for the record, that’s just when two consecutive batters homer. This could be measured as simply as how many pairs a team usually hits in a season or how many games or plate appearances teams usually go between them. I figured that a good way to estimate this would be to take the probability of a home run being hit in a plate appearance and square it. This should represent the probability of home runs being hit on consecutive plate appearances (if home runs were independently and identically distributed throughout the season). I knew that actual back-to-back home runs would be more frequent than this (due to factors like lineup construction, pitcher skill-level differences, ballparks and weather) but it would give me a baseline to start from.
In 2015, the league hit 4,909 home runs over 183,705 plate appearances. That means that a random plate appearance from the 2015 season had a 2.7% chance of being a home run, which roughly equates to a .07% chance of consecutive plate appearances each yielding a home run. To put it another way that’s one pair of back-to-back home runs every 1,400 plate appearances. The Mets, on the other hand, had just hit four pairs of back-to-back home runs in approximately 200 plate appearances. This radical discrepancy made me even more interested in investigating how often teams actually hit back-to-back home runs and how many teams have had a streak like the one the Mets had.
I loaded up my Retrosheet database and searched the play-by-play data for every time batters hit back-to-back home runs. It turns out that in 2015, teams hit 136 pairs, one every 1351 PA. This means that they occurred about four percent more frequently than my rule of thumb calculation would have predicted. It turns out that 2015 was a bit of an outlier in this regard, as the average year between 1974 and 2015 has featured about 31 percent more back-to-back home runs than the rule of thumb would predict, as shown on the chart below.
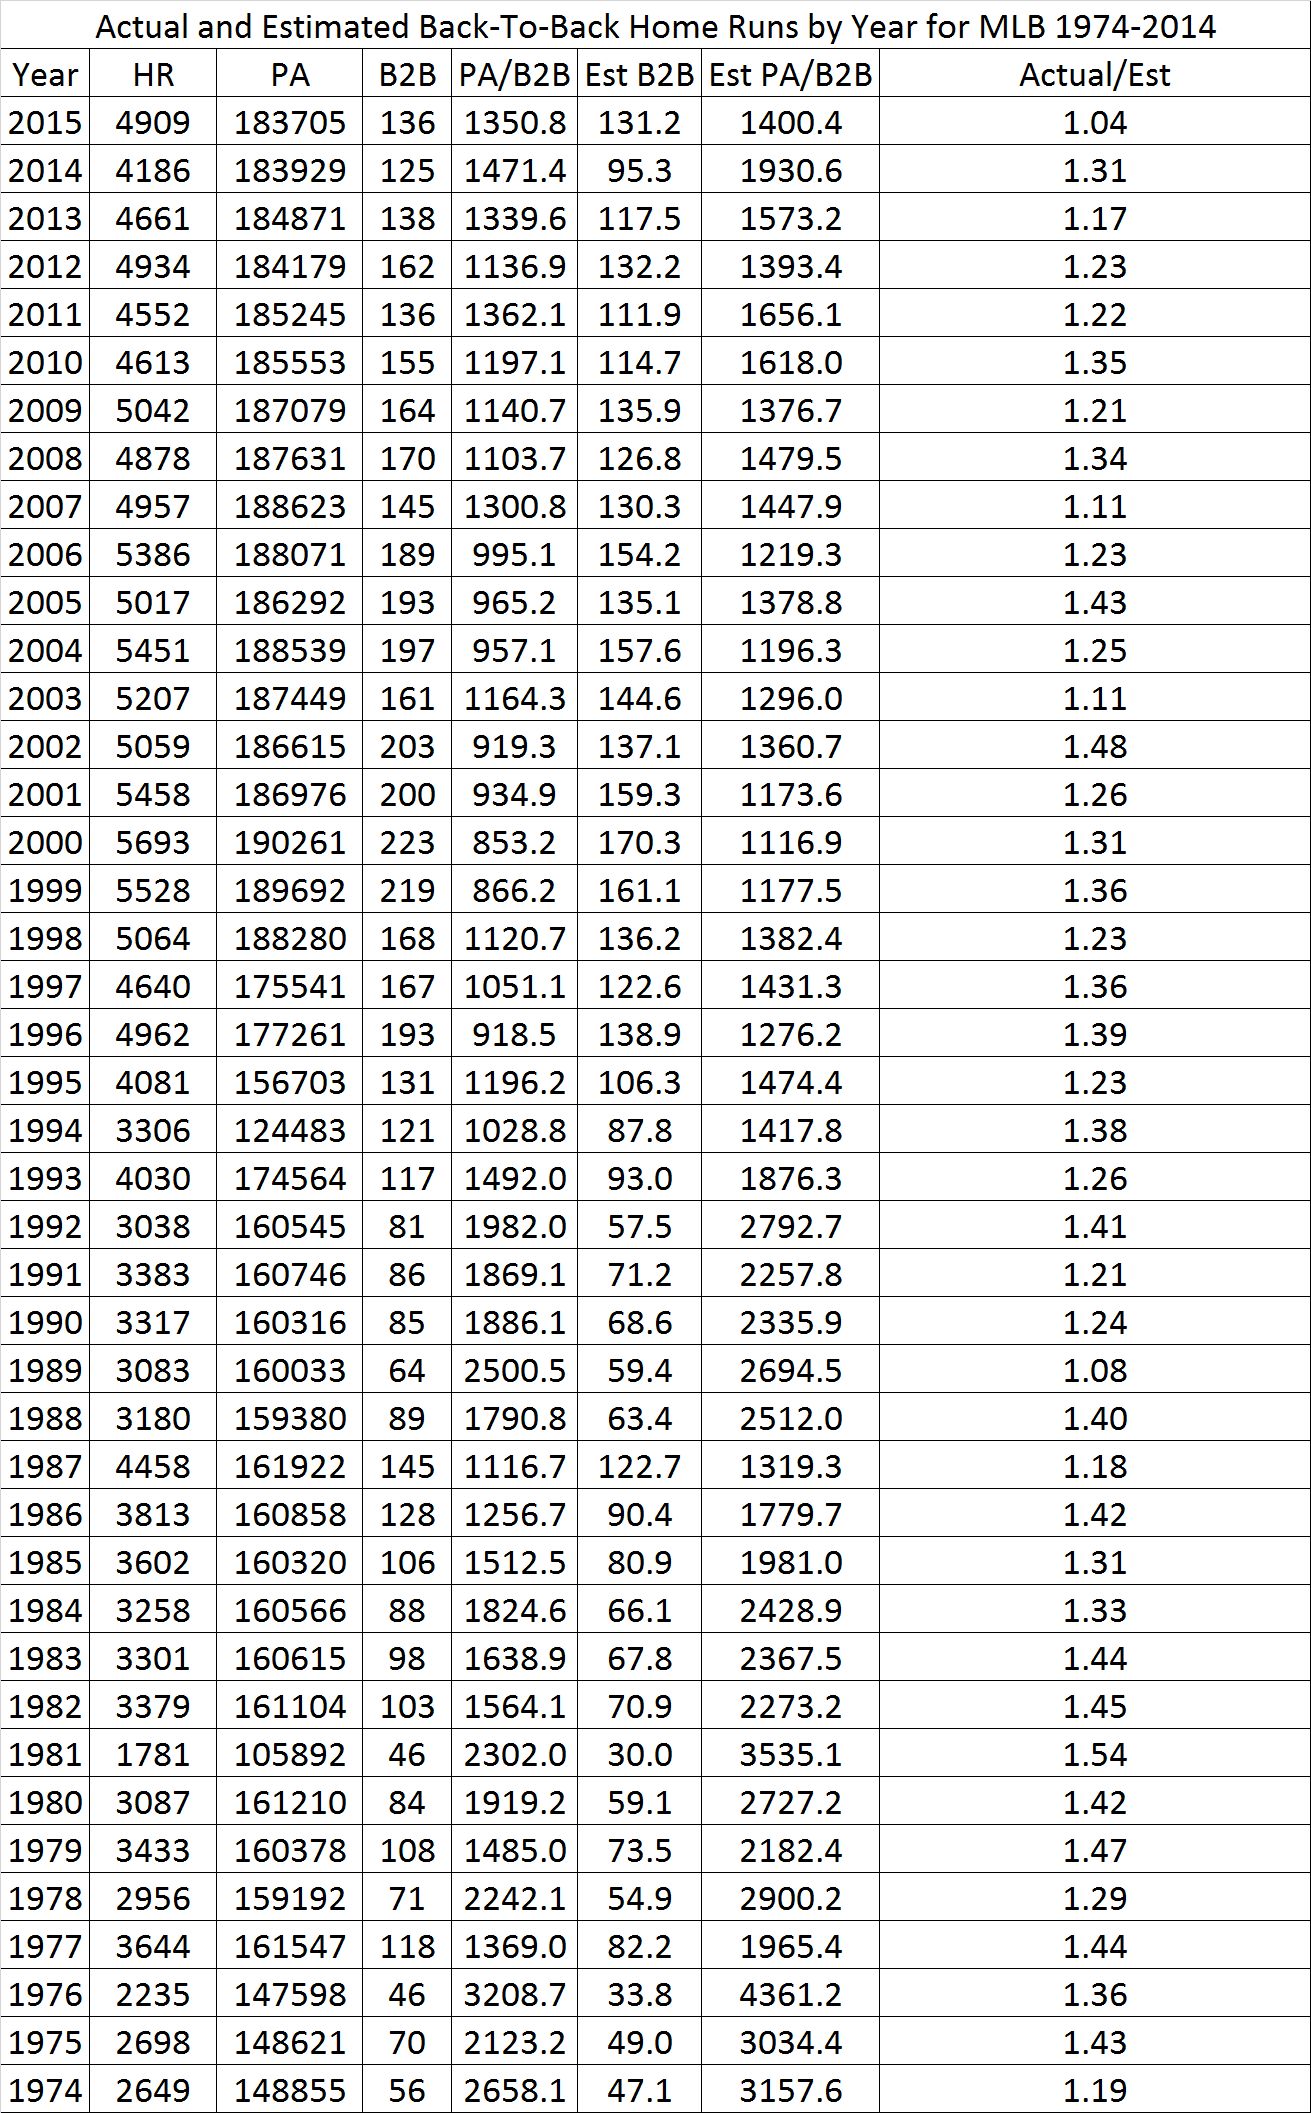
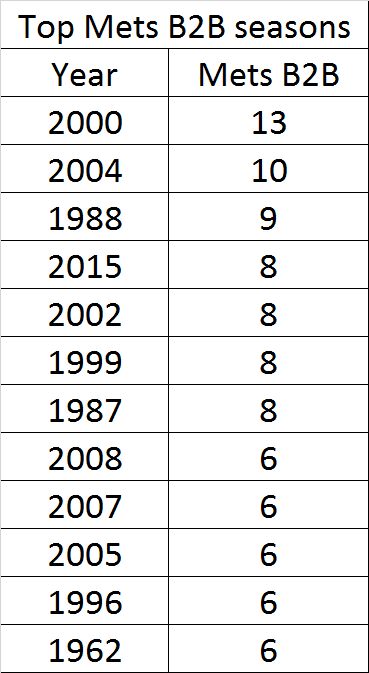
The 136 back-to-back home runs from 2015 means that teams averaged just over 4.5 pairs of back-to-back home runs last year. The Mets have averaged 3.7 pairs of back-to-back home runs per season since 1974. Three times since 1974, the Mets didn’t hit a single pair of back-to-back home runs (1977, 1978, 1980), which means they once went four consecutive seasons (1977-1980) with just one pair of back-to-back dingers. No wonder this statistical quirk jumped out at me–the 2016 Mets hit just about a year’s worth of back-to-back home runs in only six days. The chart below shows the 12 seasons where the Mets have had the most back-to-back home runs. The 2016 squad seems very likely to end up somewhere on this list.
Next, I decided to look at the best overall six-day (or fewer) periods I could find. Unsurprisingly, only 18 teams have had four or more pairs of back-to-back home runs in such a short period of time since 1974 (including the 1995 Rockies, who did it twice). I also found five teams* who did it before 1974 … including one team, the 1964 Twins who also managed it twice. I’m not including overlapping windows; I’ve filtered the list to include the earliest period with the maximum number of back-to-back home runs for each team during each period of time. For chains longer than two, each pair of consecutive home runs is counted, so back-to-back-to-back (B3B in the chart below) counts as two pairs of back-to-back home runs.
* – incomplete play-by-play data means there could be others
Incredibly, two teams managed to hit five pairs of back-to-back home runs in only three days. The 2002 Cardinals and the 1996 Dodgers share this distinction. Each of those teams played the first two games of their record-setting spans in Coors Field, which definitely helped. The two teams hit a total of 27 home runs in the six games that make up their respective streaks.
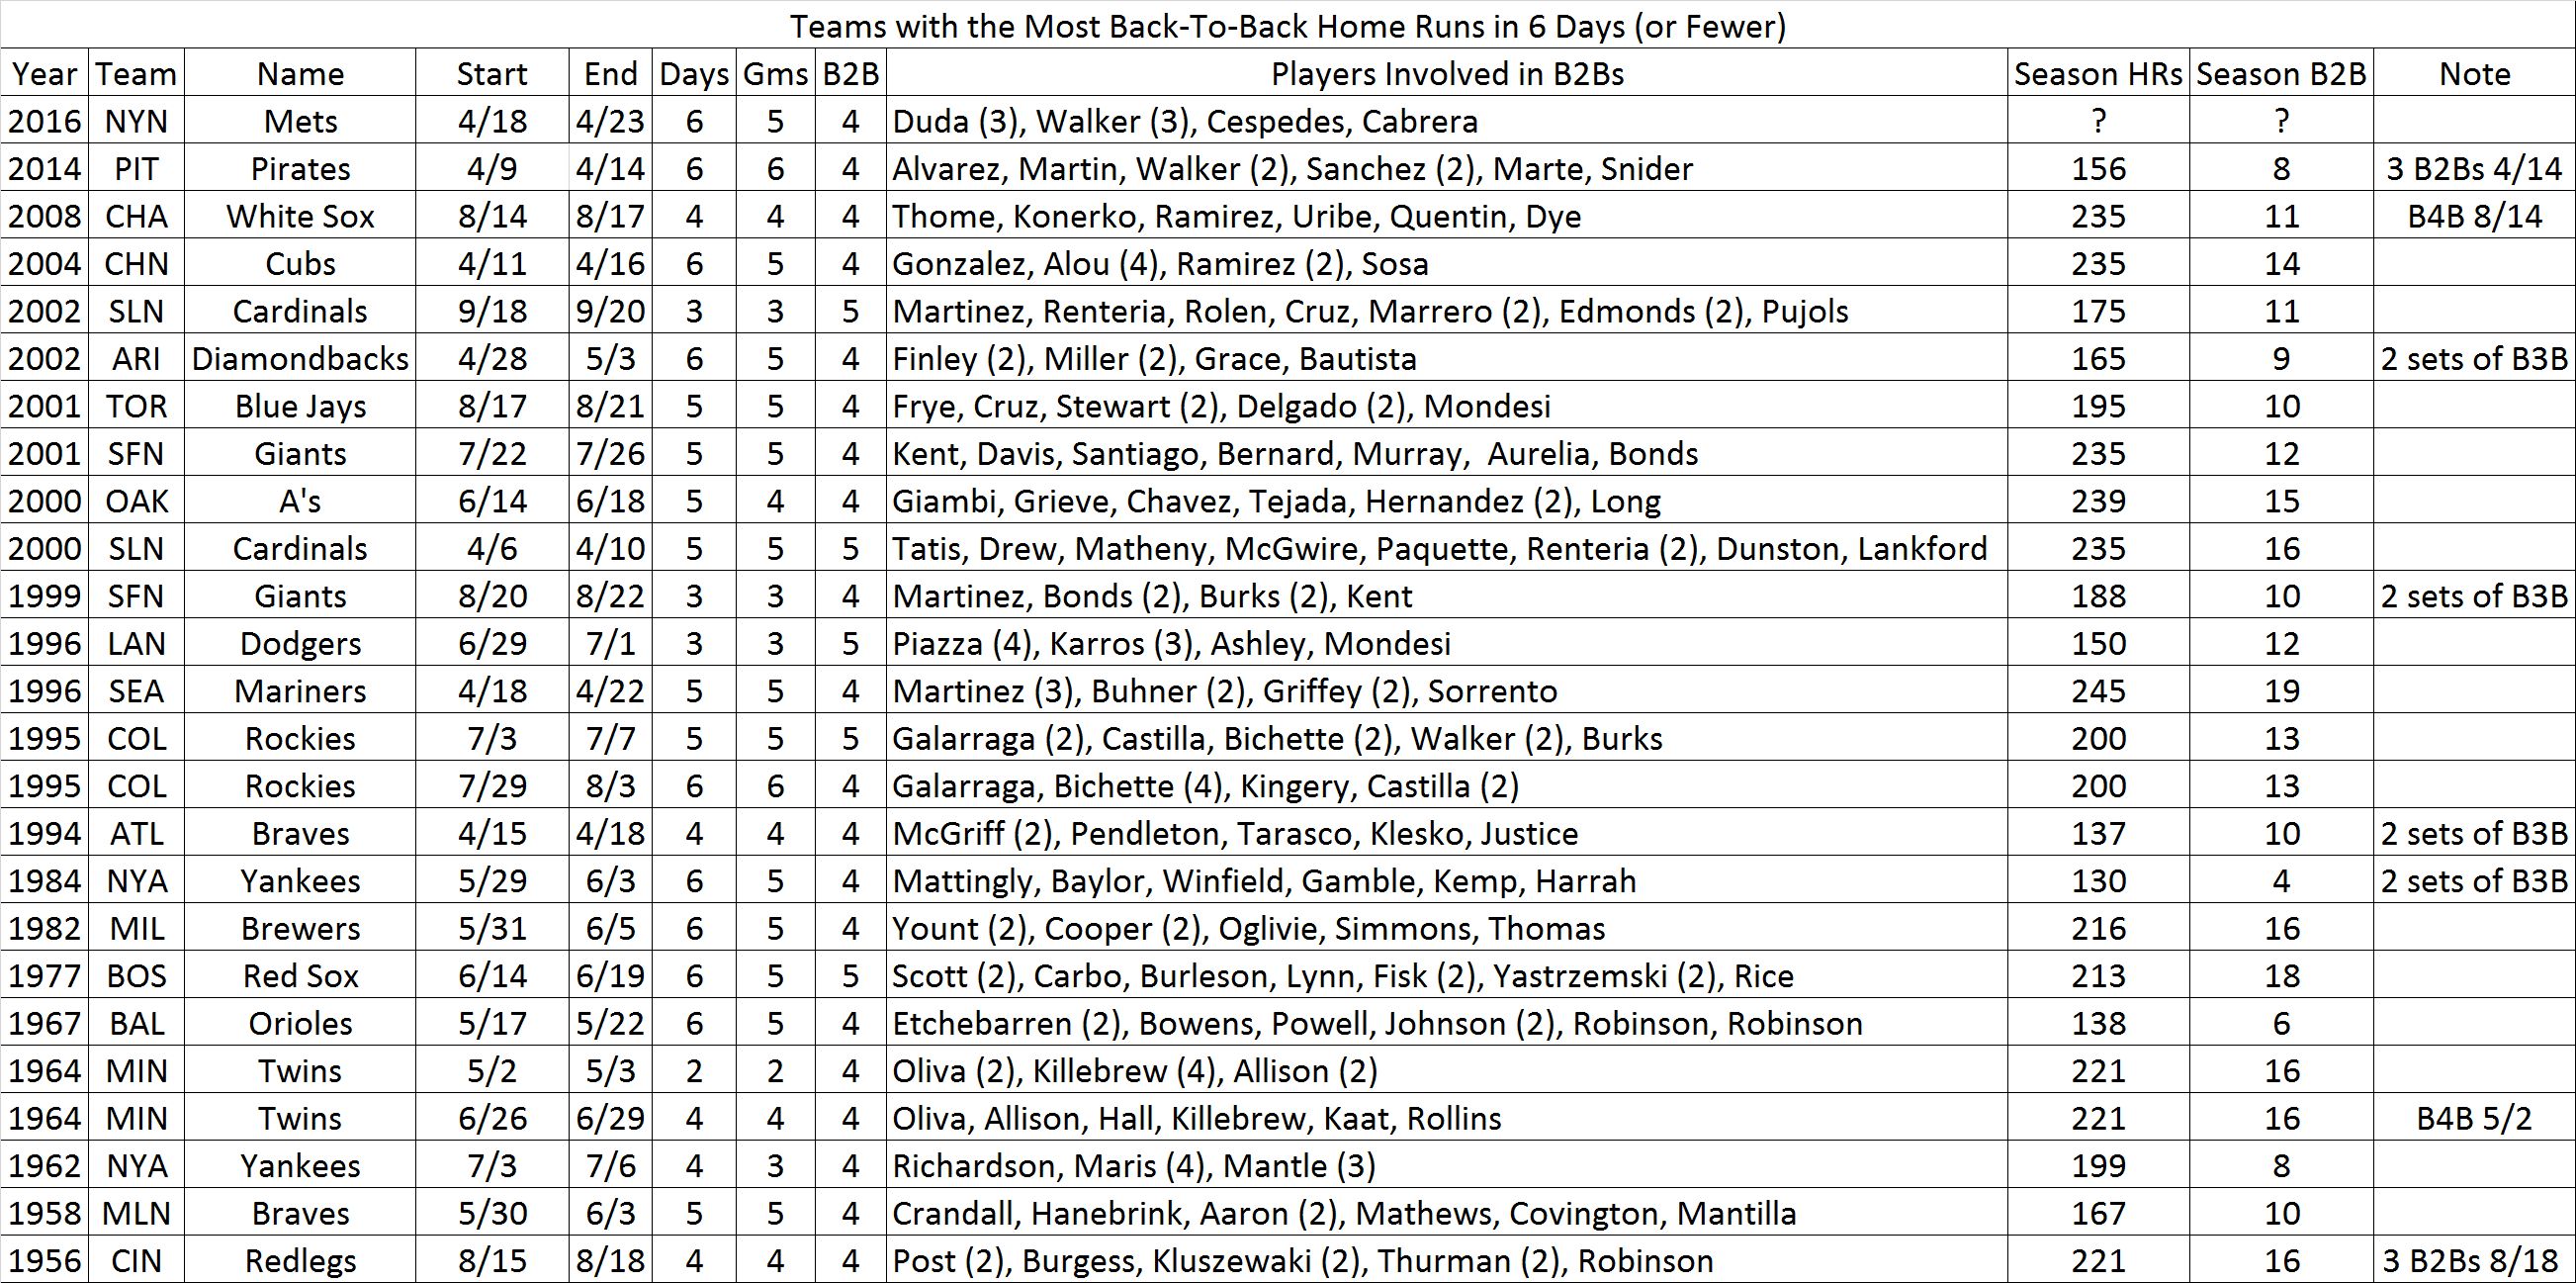
Some interesting numbers can be gleaned from this chart. The average number of back-to-back home runs in a season by a team on this list is just over 12, well above the league average of four–even if you remove the ones included in the qualifying time spans. The 22 teams on the list averaged 195.2 home runs. A number of Mets fan favorites contributed to these streaks including: Juan Uribe, Moises Alou, Carlos Delgado, Jeff Kent, Fernando Tatis, and Mike Piazza. Piazza was the driving force in the 1996 Dodgers’ record-setting streak, hitting four of the nine total home runs involved. Neil Walker was part of the two most recent teams on this list, contributing two of the home runs when the 2014 Pirates hit four pairs of back-to-back home runs in six days. Walker, of course, also hit three of the home runs during the Mets’ streak this year.
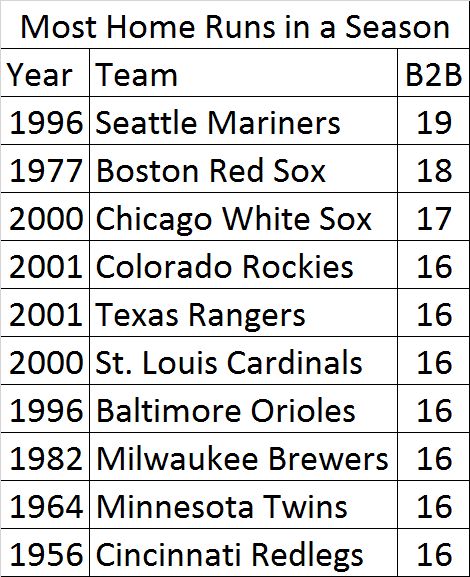
The record for the most pairs of back-to-back home runs in a season is 19, set by the 1996 Mariners. The rest of the top 10 can be seen on the chart below.
I had a feeling that the Mets’ barrage of back-to-back home runs was an unlikely and overlooked story. These rare events always stand out to me even if they aren’t entirely unique or as celebrated as something like hitting for the cycle or throwing a no-hitter. Baseball provides us with a huge number of events each year which means that a lot of rare and interesting things happen every season. It’ll be fun to keep track of how many times the Mets go back-to-back this year and to see if they can surpass the franchise record of 13 set by the 2000 team. This lineup is deep and heavy on power, a good combination to keep piling up back-to-back home runs.
Author’s Notes
I thought people might enjoy seeing the sql commands which I used to fetch the data for this article. I’ve put them in a publically accessible git repository which you can find here: https://github.com/crglaser/B2B_article. I used PostgreSQL database which I set up using the data file provided on the py-retrosheet github which can be found here: https://github.com/wellsoliver/py-retrosheet.
Between the time this article was written and published the Mets went back-to-back an additional time. In the first inning of the 5/2 game against the Braves Lucas Duda followed up Yoenis Cespedes’s home run with one of his own. It was the Mets fifth back-to-back of the season, leaving then only one shy of joining the list of most back-to-back home runs in a season above.
Thanks to Rob McQuown of Baseball Prospectus for research assistance, and a big thank you to Andy Dolan (@adolan73 on Twitter) for his help in finalizing and verifying many of the numbers in this article!
Photo Credit: Anthony Gruppuso-USA TODAY Sports
Really interesting. Out of curiosity, how did you treat back-to-back-to-back homers? As just one pair or as two pairs?
Thanks Nathan!
Back-to-back-to-back counts as 2 pairs of back-to-back home runs. I know it is one fewer home run than 2 separate pairs of back-to-back but I felt that it was the more technically true interpretation.