Player projections are future oriented—it’s built into the name. But that doesn’t mean projections from the past cease being informative as time moves forward. On the contrary, looking at pre-season projections compared to the state of things today can tell us who has been over- and under-performing the expected center, as well as how much. They can help us manage expectations in some areas, and they can also fluff them up a bit in others. Not only that, but projections don’t go away. They are updated–and ostensibly improved–with new information and performance. Viewing the very recent past through the lens of the fleeting present should provide a clearer idea of what to expect.
Baseball Prospectus’ PECOTA projection system, like others, focuses on one set of numbers for each player. But there’s much more. The single set is the median of a range of projected outcomes, from a 90th-percentile peak to a 10th-percentile valley. That’s what we’ll focus on here: Where have 2016 Mets’ players landed within their range of projections, and what can we conclude about where they’re going based on those? To simplify things, we’ll use True Average (TAv) for hitters with at least 100 plate appearances and Deserved Run Average (DRA) for the five pitchers who have mostly composed the starting rotation. TAv and DRA serve as all-in-one stats representative of the player in questions season so far. Let’s start with the bats. (All stats are through Saturday’s game.)
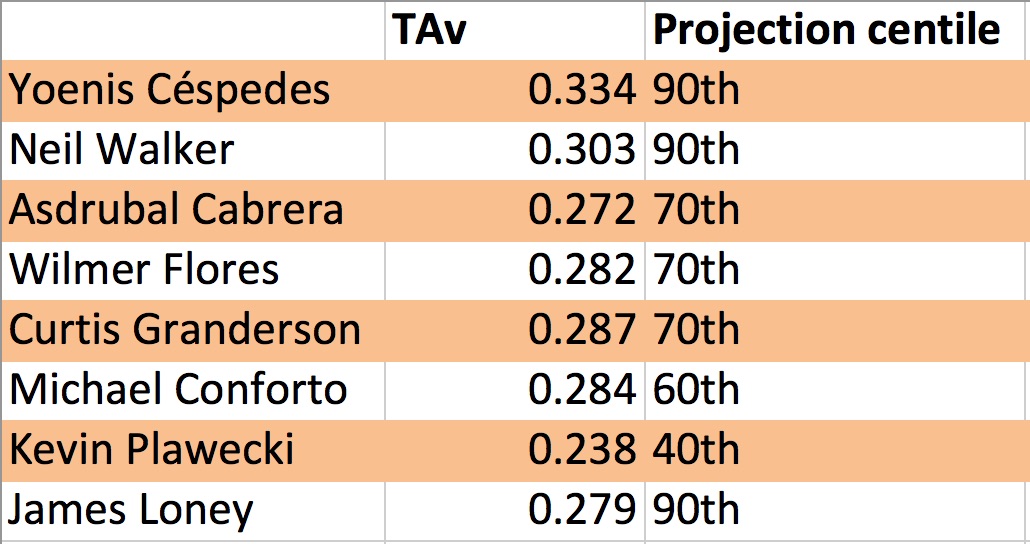
The Mets have two position players hanging around their 90th-percentile projections: Yoenis Céspedes and Neil Walker. Céspedes, in particular, is pushing the limits of “90th-percentile.” His .334 TAv is far ahead of his 90th-percentile projection, which was .312. Walker’s performance fits the confines of his pre-season range more neatly, although he’s still hanging around in rarefied air. The pre-season trade acquisition has posted a .303 TAv thus far in 2016. Coming into the season, he’s been surpassing his .296 90th-percentile projection.
One should expect most players to land anywhere from their 30th- to 70th-percentile projections. Players are more likely to be in this bulky middle than they are to be at the top or bottom, based on past performance and trends. This is where most Mets’ hitters land.
Three Mets players have performed roughly within their 70th-percentile projections: Asdrubal Cabrera, Wilmer Flores, and Curtis Granderson. Cabrera’s .272 TAv fits squarely in his 70th-percentile projection, which was also .272. Wilmer Flores, who is being featured in the Mets’ lineup more often than most expected, has also landed in his 70th-percentile projection with a .282 TAv.
Curtis Granderson and Michael Conforto are studies of contrast. The 35-year-old Granderson’s 70th-percentile .287 TAv feels like receiving too much change back from the soda you bought at Target. Just look ahead, don’t say anything, do not ask whether or not you deserve it, and maybe you’ll get to keep it. On the other hand, it feels like Conforto has achieved his 60th-percentile .284 TAv despite himself. All of that feeling can be attributed to his six-week slump.
Kevin Plawecki is the only Mets’ position player with substantial playing time to sit under his median projection. Getting playing time while Travis d’Arnaud is on the mend, Plawecki has posted a .239 TAv, which fits his 4oth-percentile projection from prior to the season.
The elephant in the room here is that names like Lucas Duda and David Wright are absent in this analysis. That’s due to their absence on the field. It also demonstrates the concession of an analysis like this. The players are up against themselves. To wit, James Loney’s .279 TAv in 118 plate appearances is closest to his 90th-percentile projection. It’s not much worse than the .285 Duda posted prior to his injury. The difference is that Duda’s performance fit into his 50th-percentile projection. He was capable of much more. Similarly, that’s why the Mets can have so many players within their 70th- to 90th-percentile projection while simultaneously offering frustration for Mets fans pleading for runs. Mets’ position players are almost uniformly playing above their pre-season median projections, at least at the plate. But that doesn’t mean the picture is rosy, regardless of whether the players start trending back toward their median projections.
The pitchers tell a different story:
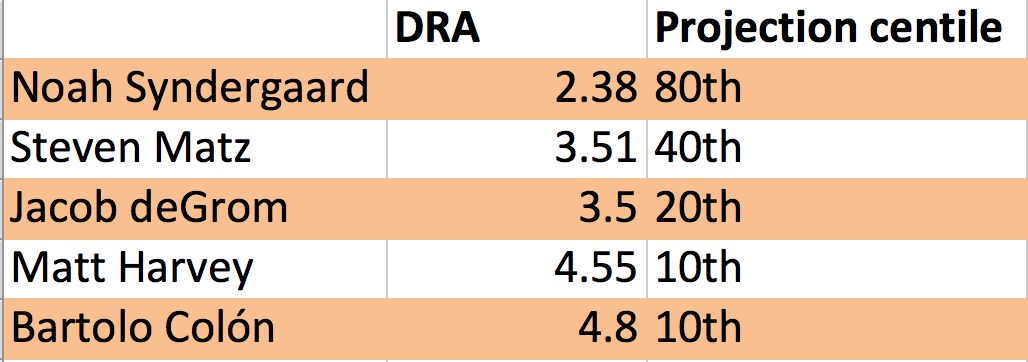
Prior to the season, season previews for the Mets frequently asked: “who is the best pitcher on staff? Is it Jacob deGrom or Matt Harvey? Could it possibly be Noah Syndergaard?” It has been Syndergaard, and he’s pitched in such a way as to eliminate that question from 2017 previews. Syndergaard has posted an excellent 2.39 DRA that somehow is not even his 90th-percentile projection. This is simultaneously a compliment to Syndergaard’s season and PECOTA’s ability to recognize that his Valhallian peak.
Syndergaard is the only starter to exceed his pre-season median projection. Matz has faltered a bit lately after a hot start to the season, and his cumulative DRA thus far has only matched his 40th-percentile projection. That deGrom’s 3.50 DRA sits at his 20th-percentile projection is at once disappointing and heartening. As Jarret Seidler recently noted in these pages, deGrom’s “down year” is the exceptional season that proves deGrom is an ace. His current season would be the best on a lot of marginally competitive teams and among the best on competitive ones.
Matt Harvey is to Mets’ pitchers as Yoenis Céspedes is to Mets’ hitters—except the exact opposite. Harvey’s 4.55 DRA is well below his pre-season 10th-percentile projection of 3.49. For a few starts, Harvey looked like he fixed what was ailing him, probably due to one of the suggestions we made about how to fix him. His most recent outing, in which he allowed four runs in six innings to the Braves, will keep the question mark present. Harvey’s pre-season projections suggest that it can’t get worse, but it’s already been worse than PECOTA could imagine. Bartolo Colón’s 4.96 is keeping Harvey company, which could be a sign that the 43-year-old is mortal after all.
Ultimately, the portion of the team that was supposed to carry the team, starting pitching, has been mostly playing below its preseason median projections. The supposed weaker side, the bats, have been playing above theirs. Still, the result is that the starting pitching is playing the largest role in the team’s early success, even if it hasn’t been doing so as effectively as it could.
What each player has done so far this season also informs PECOTA’s rest of season (RoS) projection. New information leads to new projections. Here are the RoS median projections for the position player’s looked at here, alongside their pre-season median:
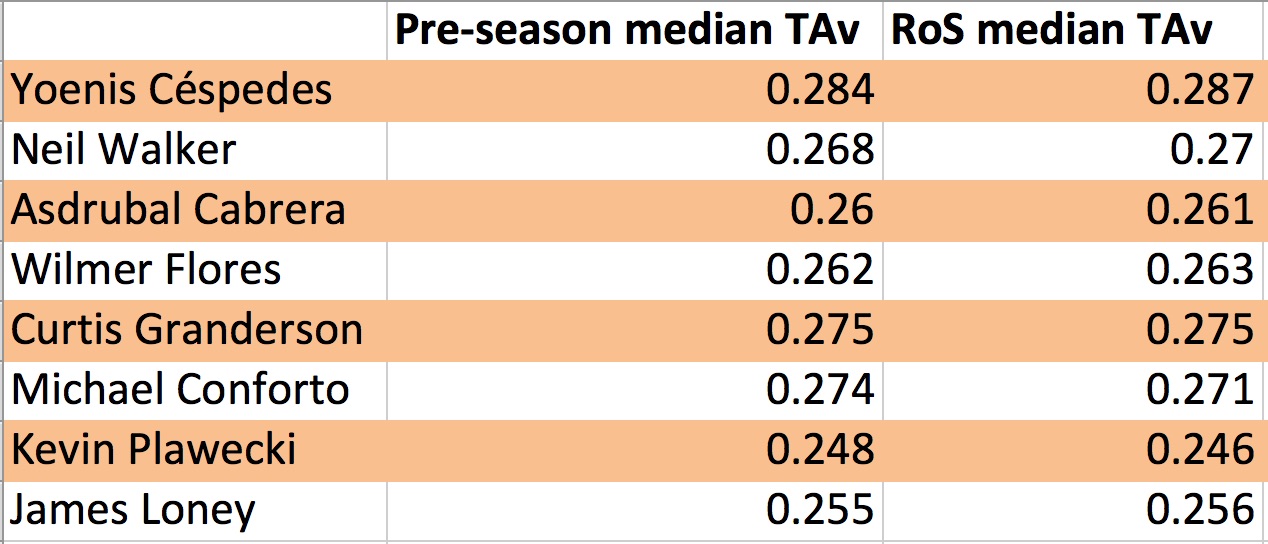
There is not a lot of change for position players. Despite performances above and below median projections, PECOTA sees most of them staying the same. Their ranges are consistent. Just like before, the story is different for the pitchers:

The RoS median projections for the five pitchers looked at here are worse than their pre-season projections—even Syndergaard. To be honest, I don’t know how to interpret this information. The revised median DRAs for Colón and Harvey appear too harsh, but reasonable given their seasons so far. deGrom’s RoS projection suggests that his center is what he’s done so far this season. That’s not the case for Matz, whose median is worse than he’s performed so far. Syndergaard’s revised 90th-percentile DRA is roughly where he’s been so far in 2016. But where he’s been is his pre-season 80th-percentile DRA.
This view accounts for the most prominent Mets players to log substantial playing time this season. The season could still hinge on how role players and returning players complement those referred to here. Having Travis d’Arnaud and Zack Wheeler return to compete with the rest of the team and against their PECOTA projections should strengthen the whole. And there’s still the question of who will get the most playing time at third base, and where that person is playing right now. Projections are oriented to the future, but these are some of the questions that have to be answered first before we can begin considering what PECOTA can tell us.
Note: At the time of his injury, David Wright’s .304 TAv fit into his 80th-percentile projection. His RoS projection is the not yet invented emoji that simultaneously conveys sadness and acceptance.\
Photo Credit: Adam Hunger-USA TODAY Sports