
Often, when watching a lot of games by the same baseball team, we might say things like “boy it sure feels like Bobby Ballplayer strikes out a lot on high fastballs,” or “golly it seems like Javier Hitter grounds into a double play every time there’s a runner on first.” Often, we seek to prove or disprove these notions. Very often, reality is somewhere in between. That’s because the feelings tend to rely on context, whereas a lot of the data we seek to prove or disprove our feelings are context neutral. Things like batting average, Wins Above Replacement Player, and wRC+. When it comes to the feeling that the Mets offense simply cannot hit with runners in scoring position, the data bears out the feeling. To make things more frustrating, there is additional data that suggests the offense is, on the whole, doing just fine.
Through Saturday’s games, the team as a whole is hitting an inconceivably bad .204 in such situations. In the expansion era (since 1961), that’s tied for the second worst mark, the worst being the 1969 Padres, who hit .201 with RISP. They are tied with the 1968 Mets. Though to be fair to the Padres and 68ers, the league only hit .248 in 1969 and .237 in 1968, The Year of the Pitcher. League-wide batting average in 2015 is .255. In sum, it both feels like the Mets turn into Brendan Ryan with one eye closed with the bases loaded, and they actually have been.
That’s not the end of the story though. It also feels like the Mets aren’t lacking for good hitters having fine seasons. And, indeed, they are not. Judged by the park adjusted and context neutral wRC+, the Mets have the seventh best offense in the National League. It approximates the Nationals, Marlins, and Dodgers offenses.
It also feels like the Mets are suffering from a serious lack of depth on offense and have given far too many plate appearances to unproductive players. But this feeling is only partially true. To get a sense of this, we can turn to a stat that Matt Gross of SB Nation’s Colorado Rockies blog Purple Row developed a few years ago. The stat is called Drag Factor. As Gross has put it, Drag Factor “is designed to measure how much ‘bad offense’ . . . drag[s] down the positive production of the good hitters.” It offers a glimpse into a team’s depth and balance.
Drag Factor is determined with the following equation:
Drag Factor=((100-wRC+)*PA)/Team total non-pitcher PA
The formula uses wRC+ and will punish a player more for being bad and sucking up a lot of plate appearances—just like that player tends to punish the team for which he plays. Players with an above average wRC+ (which is 100) aren’t included because, ostensibly, they are not dragging down the squad’s offense at all. An excellent Drag Factor will be around 5, an average mark is around 10, and a Drag Factor above 15 is considered poor. Here’s how the Mets have done so far this season (stats through Friday):
Mets Drag Factor
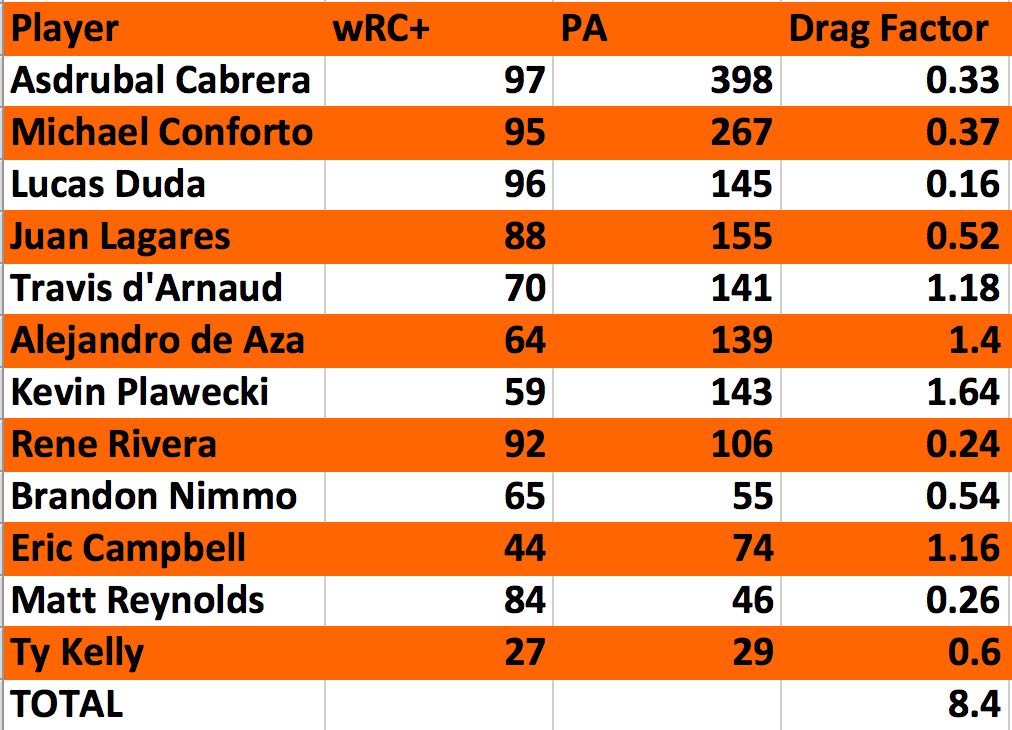
The Mets total Drag Factor, which is between good and average, tells us that the worst hitters haven’t been getting enough plate appearances to really bring the offense down. Of the eight hitters who are not accounted for here because they have been above average according to wRC+, José Reyes, Kelly Johnson and James Loney might be reasonably expected to tumble below 100 and begin dragging the offense down. The chart also indicates that players with a wRC+ close to 100 don’t burden the offense.
To provide additional context, let’s look at the Drag Factor held by a couple division rivals, the Nationals and Marlins, as well as the Cubs, who are considered a great team with a lot of depth and few weak spots.
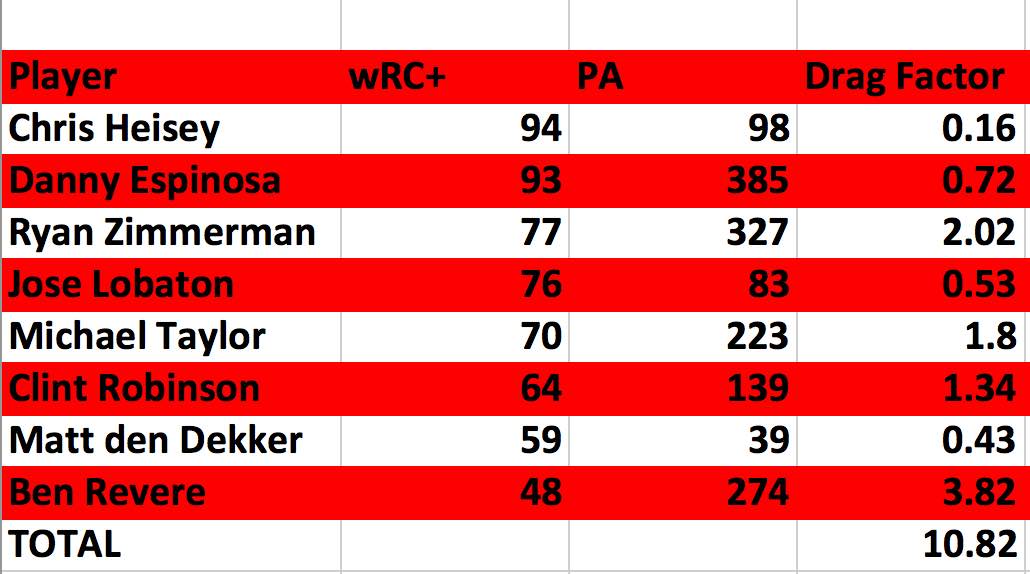
Nationals Drag Factor
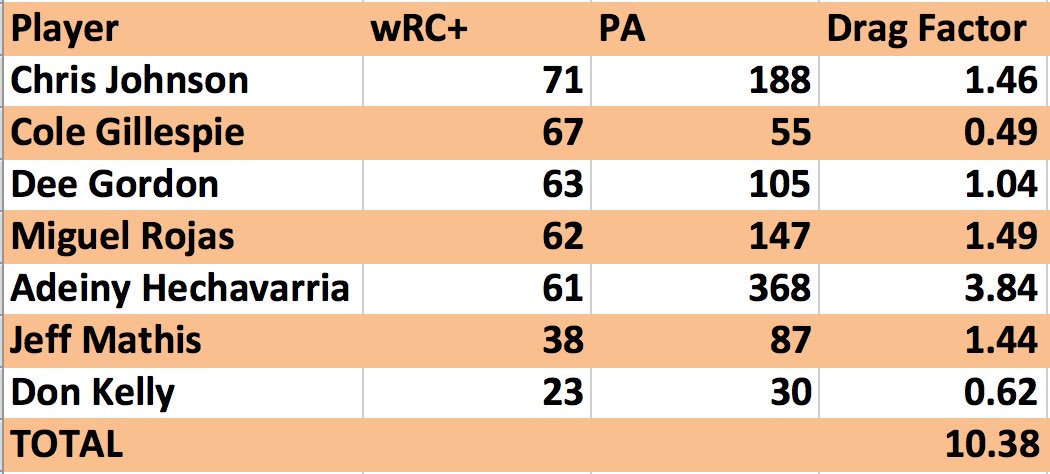
Marlins Drag Factor
Cubs Drag Factor
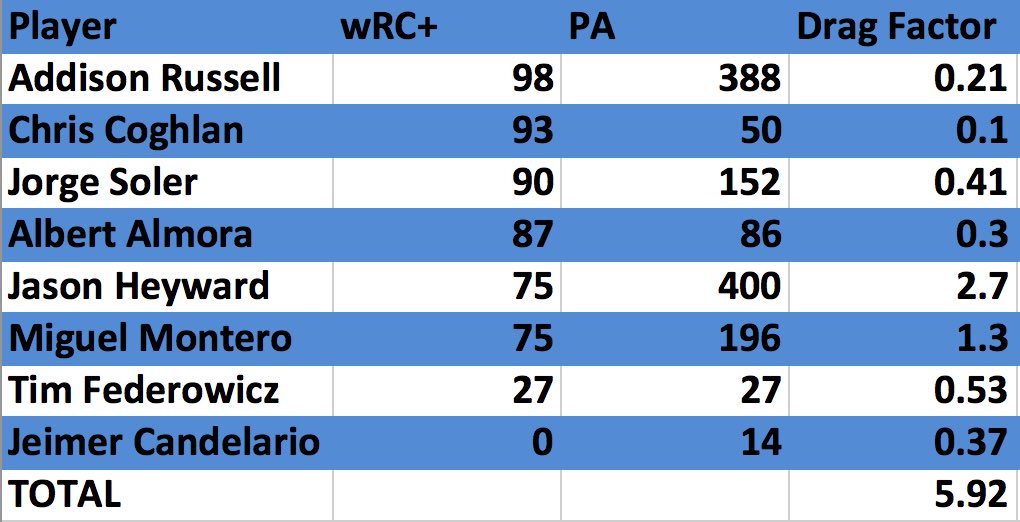
The Cubs, fortifying the feeling that they have excellent depth and few weak spots, come out spit-shined here, besting the Mets by a decent margin. Their chart is also a reminder that Drag Factor is only about offense. Jason Heyward might not be contributing on offense, but he adds value in other ways. The Marlins and Nationals, however, have more offensive hindrances, on the whole, than the Mets. Each team has given more plate appearances to equally or comparably poor hitters than the Mets have.
One way of reading these charts as a mark against the Mets’ quality of depth is that they have simply had to rely on too many different players. While Ty Kelly and Eric Campbell haven’t accrued enough plate appearances to really hurt the team, the Mets have still had to call upon both players at different times. The Mets have 12 position players represented here; the Nationals and Cubs have eight and the Marlins seven. The Mets’ Drag Factor is spread out thin, whereas more than half of the Nationals’ Drag Factor is concentrated in Ben Revere and Ryan Zimmerman. But just by looking at the Mets’ Drag Factor (like the Mets’ overall wRC+ vis-à-vis the rest of the National League), nothing appears amiss with the offense.
This is where context-dependent stats conflict with context-neutral ones. There shouldn’t be anything wrong with the Mets’ offense. Their best hitters have been producing, and even the bad ones haven’t been disastrous. With the added context of runners in scoring position, however, they’ve been historically bad.
The Mets-inclined observer is left with the hope that this will all normalize. On the one hand, the Mets offense has been extremely poor in just the way it feels like they’ve been. On the other hand, they’ve been quietly good in a way that is not immediately apparent. If the context-neutral outcomes continue apace, the Mets should see their offensive fortunes turn soon. It seems impossible that, in light of everything else, that the team can’t manage a collective batting average with runners in scoring position upwards of 50 points higher than it is right now. After all, context-dependent statistics are more useful to describe rather than to predict. But a .204(!) average with runners in scoring position in four months of baseball should also have been impossible.
That’s baseball, I guess.
Photo credit: Adam Hunger-USA TODAY Sports