Between David Wright, Neil Walker and Matt Harvey, the Mets have a lot of players trying to come back from major injuries in 2017. If you look at various projection sites, you will see different projections for how much Wright, Walker or Harvey play. If you look very closely, you may notice that no projection system offers a specific number or range for days spent on the disabled list. Last week I looked at the probability that Met position players get injured again this season. Now I’m going to try something much harder: try to write a statistical model to estimate how many games a player is likely to spend on the DL if they get hurt.
When I drafted my fantasy teams, I avoided Lucas Duda, Jay Bruce and every other hitter who may be in a timeshare. In fantasy baseball it doesn’t matter that much whether players miss games because they are hurt or sitting on the bench. They won’t give counting stats either way! As a Mets fan, if Duda is missing time, I hope it would be as part of a platoon. That means he could play, but the Mets have someone better against left-handed pitching. Projecting the number of games someone misses specifically because they are on the disabled list is important to both teams and fans.
It’s surprisingly complicated to get a good statistical estimate of how many days a player may miss due to injury. I’m going to start by explaining why projection systems would have so much difficulty with time spent on the DL. Then I will give my model for games missed. If you want to skip ahead, just search for “get to the results already!” As usual, anything involving a formula will be saved for #gorymath motes at the end.
Why Days On DL Breaks Most Stats Models
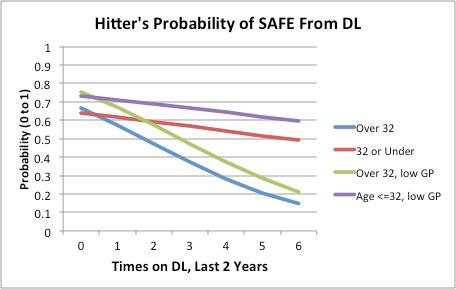
To understand why the number of days a player loses to injury is so deceptively hard to predict, we need to start by looking at its distribution.
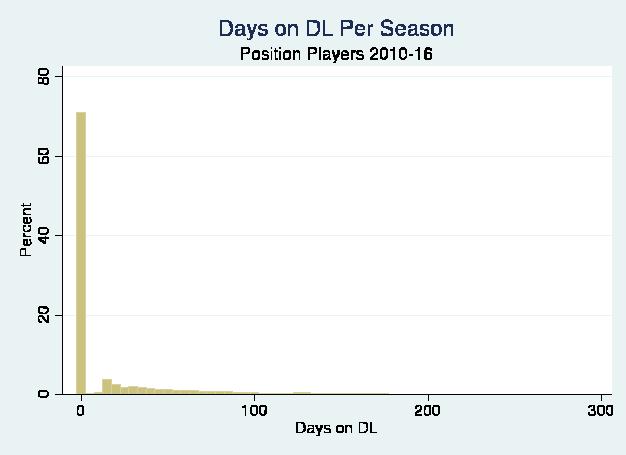
This graph is taken from Baseball Prospectus’ transaction tracker (for injuries) and Retrosheet’s play-by-play data. Every hitter who made at least one appearance in a season is included here. Cup of coffee players like Gavin Cecchini (seven plate appearances last year at age 22) skew these results a bit because they get demoted before they have much of a chance to suffer a major league injury. However, it’s more important to focus on the big picture. We’d really have to focus and zoom in to see the tiny bars for players who spent 46-50 days on the DL, let alone 96-100 days. There are so many position players who spend zero days on the DL in a particular season that it drowns out these differences. (It’s the same story for pitchers.)
Basic statistical measures like correlation and ordinary least squares regression get as bogged down by all those zeroes as the naked eye. Unfortunately, statistical programs will not give you a warning siren or a bright red error message if you tried looking for correlations. There are a wide range of assumptions for using measures like correlation and regression. One of the biggest assumptions is that variables – particularly dependent variables – should be normally distributed (i.e. a bell curve).
When I taught statistics, I usually fudged this assumption a bit to write homework problems. I could either take something dull and boring from a textbook, or take something from the real world that’s close enough. I wanted to make sure my students could understand results and explain them in everyday English, so I chose real life variables like income that are close enough to a normal distribution. When you’re stuck teaching stats at 8 a.m., you try anything you can to make it a little less painful. If we look back at days spent on the disabled list, it’s not remotely close to a bell curve. At best, correlations and ordinary least squares regressions would be inconclusive and not misleading.
Asking whether or not a player gets injured – a yes or no question – is the one step up in technical difficulty. In my graduate program, everyone had to learn the basic regressions (even qualitative researchers) but only quantitative students had to learn these logistic regressions for yes/no outcomes. Jeff Zimmerman posted a series of articles with this approach years ago on Fangraphs, focused on starting pitchers. Last week I used this approach to look at hitters.
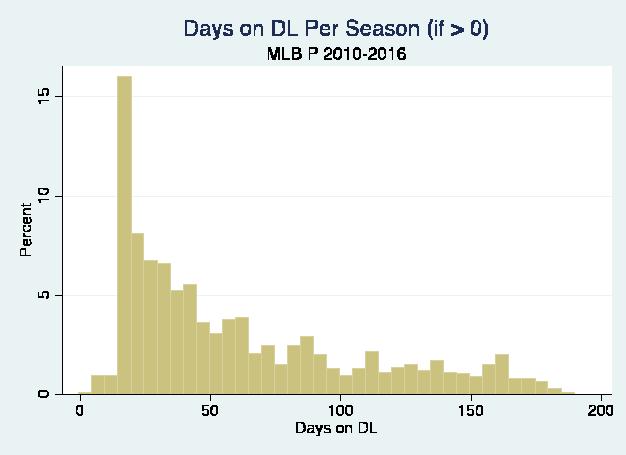
One of the best ways to build on this would be to find a way to answer both the yes/no will someone get injured question and the “how severe is the injury?” question at the same time. Matt Harvey missing a start because of a bladder infection is very different than him missing time due to Tommy John surgery or a major shoulder injury. Unfortunately, putting these pieces together isn’t as simple as running logistic regressions and then running an ordinary least squares regression with players who got hurt. To understand why, let’s take a look at the distribution for time spent on the disabled list just for players who went on the DL.
And now for hitters:
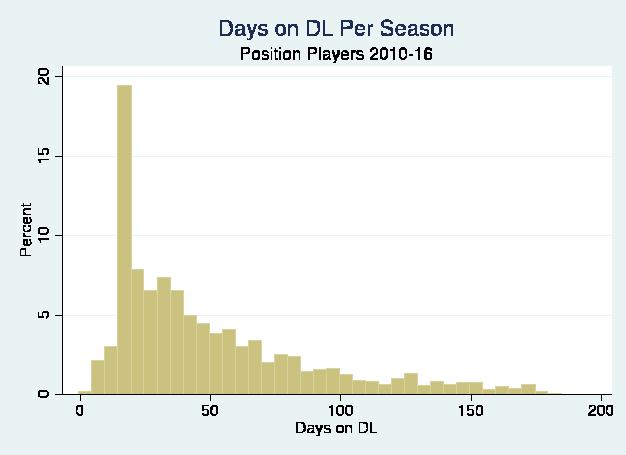
Now that we can actually see all those little blips from the first graph, we can see that time spent on the disabled list still isn’t a bell curve even if we limit it to players who got hurt. There is a large clump of players who only spend 15-20 days on the DL. Then we have the large tail of players spending 50 or 100 days or more on the DL. Variables where we count things have unique properties. It’s fairly common to get people bunched up with lower values and a long stretched out tail instead of a bell curve. Think of how many books you read last year. Most people only read a few books annually. They may not read any. However, there are also people in monthly book clubs and people who read books for work.
Trying to use basic statistical techniques with count variables is like trying to jam a square peg in to a round hole. We might be able to make it work, but the peg is going to get distorted in the process.1 With a variable as abnormally distributed as days spent on the DL, we’re going to get covered in leftover debris. It takes specialized regression techniques to assume we have a round hole, and we want to reshape all our independent variables (the pegs) to fit this round hole as well as possible. These models tend to get skipped in statistics classes, since they are much more useful for sports than traditional academic questions.
Get to the Results Already!
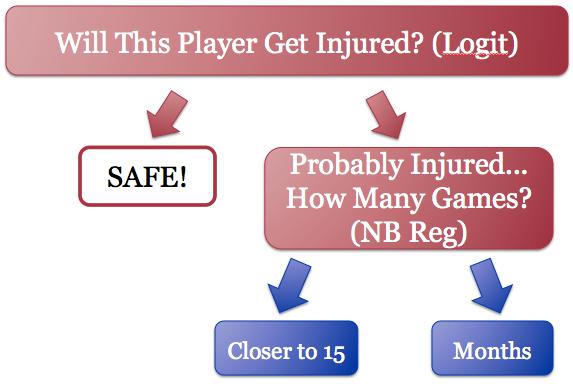
There is a specialized statistical model that is perfect for two-step questions like whether or not someone will get hurt and how many games they miss. However, it’s one of those things that sits in the last chapter of an advanced stats textbook and never gets assigned even in PhD level classes.2 The zero-inflated negative binomial (zinb) regression model is like a flowchart. We start with the logistic regression from last week, represented by the red boxes. Think of the arrows as all the independent variables. Then I add a second step, a count model for players who are probably hurt (the blue boxes). 3
Larger sample sizes are more important with such a complex model, so I included every player from 2010-2016 who had at least two prior seasons and 100 games played (same as last week). Since I already used a simpler statistical model for the first part of the flowchart last week, let’s start by seeing whether the zinb model gives similar predictions for whether or not someone gets injured:
| Player | Prior Injuries | Over 32? | Inj %: Logit | Safe %: zinb |
| Jay Bruce |
0 |
N |
35.90% |
64.01% |
| Asdrubal Cabrera |
2 |
N |
40.70% |
59.21% |
| Yoenis Cespedes |
1 |
N |
38.30% |
61.64% |
| Michael Conforto |
0 |
N |
35.90% |
64.01% |
| Travis d’Arnaud |
3 |
N |
43.20% |
56.73% |
| Lucas Duda |
2 |
N |
40.70% |
59.21% |
| Wilmer Flores |
1 |
N |
38.30% |
61.64% |
| Curtis Granderson |
0 |
Y |
33.10% |
66.88% |
| Juan Lagares |
2 |
N |
40.70% |
59.21% |
| Jose Reyes |
2 |
Y |
52.80% |
47.17% |
| Neil Walker |
1 |
N |
38.30% |
61.64% |
| David Wright |
2 |
Y |
42.20% |
57.55% |
The zinb model is a little different because it predicts the likelihood of someone having a zero – in our case zero games lost to injury. If we add the predictions together they add up to around 99.9 percent for each player. It’s a good thing these predictions are so close. Instead of saying some players are safe from injury while others are at risk, we can reasonably interpret the first part of the flowchart as not injured versus injured. We don’t have to worry about players being in the “at risk of injury” bin but not actually missing games due to injury. The complex statistical model agrees with baseball tradition that being hurt is something you could play through, but injury is something you can’t play though.4
Instead of giving the mean number of days a player is expected to miss, I will give a range of outcomes and the player’s predicted probability for falling in each bin. The zinb model can give specific predictions like other statistical models. However, it doesn’t mean much to say players with Lucas Duda’s statistical profile spend 18.5 days on the disabled list “on average.” The majority of players with his profile will spend zero days on the DL! If we want to talk about major injuries like Duda’s back, the average of 18.5 games won’t matter much either. One of the major advantages of the zinb model is the ability to account for injuries that are much longer than average and give us a fuller range of possibilities:
| Player | No DL | <=20 days | 21-35 | 36-60 | 61-90 | 91+ |
| Jay Bruce |
64.01% |
11.61% |
9.83% |
9.39% |
3.86% |
1.30% |
| Asdrubal Cabrera |
59.21% |
9.27% |
9.55% |
11.61% |
6.68% |
3.68% |
| Yoenis Cespedes |
61.64% |
8.75% |
8.99% |
10.91% |
6.27% |
3.44% |
| Michael Conforto |
64.01% |
8.22% |
8.45% |
10.24% |
5.87% |
3.21% |
| Travis d’Arnaud |
56.73% |
9.69% |
10.05% |
12.32% |
7.17% |
4.04% |
| Lucas Duda |
59.21% |
9.16% |
9.49% |
11.61% |
6.75% |
3.78% |
| Wilmer Flores |
61.64% |
8.74% |
8.99% |
10.91% |
6.27% |
3.45% |
| Curtis Granderson |
66.88% |
8.88% |
8.41% |
9.22% |
4.59% |
2.02% |
| Juan Lagares |
59.21% |
9.24% |
9.53% |
11.61% |
6.70% |
3.71% |
| Jose Reyes |
47.17% |
9.75% |
10.99% |
14.91% |
10% |
7.18% |
| Neil Walker |
61.64% |
8.72% |
8.98% |
10.92% |
6.28% |
3.46% |
| David Wright |
57.55% |
7.63% |
8.68% |
11.94% |
8.12% |
6.08% |
There’s a lot going on here. Instead of just walking through the 11 different independent variables, I think the best way to explain what’s going on is to pull out two or three players at a time. What makes them similar? What makes them different? Then I’ll try to look at whether there’s anything about the 2016 Mets as a team that made them more injury prone and whether this is likely to repeat in 2017.5
Durable Outfield: Avoiding Injury and Recovering Faster
| Player | High GP | Old | No DL | <=20 days | 21-35 | 36-60 | 61-90 | 91+ |
| Jay Bruce | Y | N |
64.01% |
11.61% |
9.83% |
9.39% |
3.86% |
1.30% |
| Yoenis Cespedes | N | N |
61.64% |
8.75% |
8.99% |
10.91% |
6.27% |
3.44% |
| Michael Conforto | N | N |
64.01% |
8.22% |
8.45% |
10.24% |
5.87% |
3.21% |
| Curtis Granderson | Y | Y |
66.88% |
8.88% |
8.41% |
9.22% |
4.59% |
2.02% |
The Mets four most durable position players headed in to 2017 are competing for three spots in the outfield. Chances are Terry Collins will have to make a choice about who sits instead of relying on one player to get hurt and “solve” the problem. I’d much rather have the surplus of healthy players, but I won’t be the one people yell at for choosing the wrong player!
Jay Bruce is as durable as any player in the league, according to my model. He’s not 33 years old yet and he doesn’t have any injuries in the past two seasons, which makes him relatively unlikely to get hurt this season. We could say the same things about Michael Conforto. The difference between these players is Bruce has shown the ability to play in 300 games over the past two seasons, while Conforto hasn’t had that opportunity yet. Once a player has demonstrated a track record of being in the top 10 percent for games played, it doesn’t mean they are less likely to get injured this season. It means they will probably recover faster if they get injured. Conforto might have the same level of durability as Bruce, but we can’t know for sure until he gets a chance to play every single day.
My regression model shows playing more games in the past two years doesn’t make a player immune to injury. Bad breaks can happen to anyone who steps on the field. Yoenis Cespedes illustrated this principle the hard way last year when he got injured. Cespedes played in 311 of 324 possible regular season games in 2014 and 2015. This durability wasn’t enough to prevent an early season thigh bruise or the August quad injury that forced him to the DL. Cespedes came back from the DL exactly 15 days later. The recuperation ability that helped him stay in just about every game in 2014 and 2015 helped him get off the DL faster. Unfortunately some players lose a bit of this recuperation ability after an injury, so Cespedes is a higher injury risk this year.
Curtis Granderson is an unusual case. He’s one of the few position players age 33 or older who has avoided injury and played in at least 300 games over the past two seasons. Older players who avoid injury have learned how to best maintain their bodies, along with getting some good luck along the way. As a result, Granderson is the least likely to get injured. He gets the same recuperation bonus as Bruce. However, older players will tend to spend more time on the disabled list if the get hurt. Granderson’s overall injury risk may be lower than Bruce’s, but Granderson is more likely to miss a large chunk of time if age catches up to him.
Severe Injuries Aren’t More Predictive
| Player | Inj | Days | No DL | <=20 days | 21-35 | 36-60 | 61-90 | 91+ |
| Asdrubal Cabrera |
2 |
34 |
59.21% |
9.27% |
9.55% |
11.61% |
6.68% |
3.68% |
| Lucas Duda |
2 |
135 |
59.21% |
9.16% |
9.49% |
11.61% |
6.75% |
3.78% |
| Travis d’Arnaud |
3 |
147 |
56.73% |
9.69% |
10.05% |
12.32% |
7.17% |
4.04% |
Last week I wrote that it is the number of injuries a player suffered over the past two seasons, not the number of games missed, that best predicts whether they will get hurt again this season. However, it’s possible that severe injuries predict that if a player gets hurt again, the new injury is also more likely to be a severe injury. This makes sense for pitchers, who keep putting strain on the same parts of the body. Tommy John is not a perfect surgery and even pitchers who succeed in their rehab may be at higher risk for another major elbow injury.
For hitters, I found the severity of prior injuries does not predict how long they will be on the DL if they get injured again this season. Neither does the total number of injuries. Duda and Cabrera both suffered an injury in 2015 and 2016. Duda has spent 101 more days on the disabled list. However, their injury risk profiles are almost identical for 2017, according to my statistical model. Duda and d’Arnaud spent nearly the same amount of time on the DL, but d’Arnaud had trips for three separate injuries. Someone who keeps getting injured is a bigger red flag than someone who suffered a severe injury.
One possible explanation is that repeated stress on the same body part is what makes each injury worse than the previous injury. This doesn’t always apply to hitters. David Wright has his ongoing battle with spinal stenosis. Jose Reyes had regular hamstring issues. Lucas Duda’s minor back strain in 2015 turned in to a major injury in 2016. However, Carlos Beltran’s major knee injury to start the 2010 season hasn’t forced him to the DL since then. Curtis Granderson missed the start of 2013 with a fractured right forearm, came back, and fractured his left hand less than two weeks later! The Yankees let him go in free agency, and the Mets have benefitted from three injury-free seasons. This is what a statistical non-relationship looks like with real players. Different players follow different patterns.
Age and Injury Risks
| Player | Inj | Old | No DL | <=20 days | 21-35 | 36-60 | 61-90 | 91+ |
| Curtis Granderson |
0 |
Y |
66.88% |
8.88% |
8.41% |
9.22% |
4.59% |
2.02% |
| Jose Reyes |
2 |
Y |
47.17% |
9.75% |
10.99% |
14.91% |
10% |
7.18% |
| Asdrubal Cabrera |
2 |
N |
59.21% |
9.27% |
9.55% |
11.61% |
6.68% |
3.68% |
The thing that surprised me most when I did my models for whether a position player gets injured was old players weren’t automatically injury prone. Granderson came out as the Mets hitter least likely to get injured! In this model he’s the player most likely to get a “safe from injury” card, while Reyes is the least likely to get that card. The difference is Granderson has been injury free the last two years, while Reyes has two injuries. Prior injuries are generally a risk factor for going on the DL this season, but each prior injury carries four times the risk for players over 32 years old.
All other things being equal, older players spent 14.67 percent longer on the disabled list if they had to go on the DL. The difference is statistically significant, but it’s really just icing on the cake. Granderson is still less likely to suffer a serious injury than Cabrera. The main issue is that old players coming off of injuries are much more susceptible to getting another injury. They may also be susceptible to recurring injuries throughout the year. My model is for total games missed in a season, not the biggest single injury. I tried other ways of making age a variable for the number of days on the DL, but they only made the model worse.5
Trying to Account for Spring Injuries
| Player | No DL | <=20 days | 21-35 | 36-60 | 61-90 | 91+ |
| David Wright |
57.55% |
7.63% |
8.68% |
11.94% |
8.12% |
6.08% |
| David Wright | HURT |
10.08% |
13.87% |
23.58% |
21.93% |
30.95% |
Wright is a major outlier. My statistical model knows he has two prior injuries. It doesn’t know he has spinal stenosis. Baseball players are notorious for freak injuries like slipping in the shower, but they tend to get hurt when they’re on the field playing. Wright looks like less of an injury risk than Reyes because he’s so inactive. Unfortunately, his first move of the season was to the disabled list with a major injury. We know he won’t be in the “Safe from DL” category. How can we sort this out?
One option is to roll the dice on the prediction we already have for Wright and re-roll if we land on Wright being safe from injury. However, we know players who start on the DL often have major injuries or issues that could flare up again and again throughout the season. I added a “start season on the disabled list” variable to the second step of the flowchart. We can’t add it to the “is the player safe from injury” step because the answer is always no.7 Players who started the season on the disabled list spend 42 percent longer on the DL than players who go on in-season. It’s the single largest effect on length of DL stays.
Some of this can be explained by the fact that the earlier you get hurt, the more games you can miss in a season. A.J. Pollock missed almost the entire season because he fractured his elbow at the end of spring training. If he fractures his elbow in August, the injury is just as severe, but there are no games to miss in November. We can say the same about Kyle Schwarber’s injury in his second game of 2016. Then again, if players are rushed back too soon from preseason injury, they may re-injure themselves.
Adding the “starts on the DL” variable isn’t enough. Players who fit David Wright’s statistical profile had a 57.55 percent chance of not getting injured. But we know Wright is on the DL. To account for this, I multiplied all the injury bands by the same number so they add up to 100 percent again. The results were so bad I stopped writing for a day. My model predicts a 50-50 chance that Wright will miss at least two months, and a 30.95 percent chance that he misses at least three months. David Wright is a bit of a tragic outlier though due to his spinal stenosis. Let’s see what happens when I apply this principle to the more run-of-the-mill spring training injury for Juan Lagares:
| Player | No DL | <=20 days | 21-35 | 36-60 | 61-90 | 91+ |
| Juan Lagares |
59.21% |
9.24% |
9.53% |
11.61% |
6.70% |
3.71% |
| Juan Lagares | HURT |
13.02% |
16.52% |
26.03% |
21.45% |
22.97% |
It’s not just Wright. In general, my model is pretty pessimistic about players who start on the DL. Some of this can be explained by the fact that the earlier you get hurt, the more games you can miss in a season. A.J. Pollock missed almost the entire season because he fractured his elbow at the end of spring training. If he fractures his elbow in August, the injury is just as severe, but there are no games to miss in November. We can say the same about Kyle Schwarber’s injury in his second game of 2016. Then again, if players are rushed back too soon from preseason injury, they may re-injure themselves.
What About Team Doctors or Chain Reactions?
All of this discussion about how long players will be injured assumes these injuries are completely separate from each other. One player taking a baseball to the groin is unlikely to cause a teammate to hurt his shoulder a week later. But when teammates get hurt, they will go to the same team doctor. Good medical staff may be able to help players return from injury faster and/or keep them from returning too fast and re-injuring themselves. If a team called 1-600-DOCTORB and got Dr. Nick Riviera from the Simpsons, the recovery process may not go so well. Even if every team has a good medical staff, organizations may have different philosophies on how quickly to bring players back and when to shut someone down for the year.
The first thing I did to test for any team-wide effects was add a variable for how many days a player’s teammates spent on the disabled list in a particular season. I removed all pitchers, on the assumption that hitters’ injuries may be more likely to cause a chain reaction with other hitters. If a player was on multiple teams, I took the average for all those teams instead of trying to parse injury time to the date of a trade, release, etc. Mets’ position players spent 519 days on the DL last year, which is in the top 10 percent for most injured teams in my database. To illustrate how chain reactions can work, here are a few examples:
| Team Inj | No DL | <=20 days | 21-35 | 36-60 | 61-90 | 91+ | |
| Asdrubal Cabrera | None |
59.21% |
10.60% |
10.21% |
11.43% |
5.86% |
2.69% |
| Asdrubal Cabrera | Median |
59.21% |
9.27% |
9.55% |
11.61% |
6.68% |
3.68% |
| Asdrubal Cabrera | Mets 2016 |
59.21% |
8.21% |
8.93% |
11.60% |
7.33% |
4.72% |
| Team Inj | No DL | <=20 days | 21-35 | 36-60 | 61-90 | 91+ | |
| Jose Reyes | None |
47.17% |
11.23% |
11.93% |
15.05% |
9.12% |
5.50% |
| Jose Reyes | Median |
47.17% |
9.75% |
10.99% |
14.91% |
10% |
7.18% |
| Jose Reyes | Mets 2016 |
47.17% |
8.59% |
10.13% |
14.60% |
10.64% |
8.87% |
The main theory behind a chain reaction of position player injuries is that a starter gets hurt, so the backup gets forced in to an everyday role. The backup may not be ready for that role, or he may be an older veteran who ideally shouldn’t play six games a week. So he gets hurt, and the spiral continues. Jose Reyes at third and Justin Ruggiano’s short callup to play center field both seem like examples of this theory. However, the amount of time teammates spend on the DL was not a significant predictor of whether a position player gets injured.8 So how could chain reactions work?
1) The chain reaction is more about exposing players to season-ending injury than minor injuries. A team that already has a few key injuries may keep pushing their remaining star players to play through minor injuries. Players may want to try and carry the torch for injured teammates. Either way, pushing too hard may cause minor injuries to get worse. Neil Walker played in 109 of 118 team games and was coming off a streak of playing 20 straight games when he first injured his groin in Arizona.
2) Teams with major in-season injuries may try to add unsigned free agents instead of promoting minor leaguers to fill the roster hole. These players may be more injury prone and only getting a chance on teams that already have injuries. Therefore, the chain reaction could be a kind of false positive.
3) If a team has a lot of injuries to position players, they probably aren’t scoring enough runs to be a playoff contender. In that case, the current slotting system in baseball’s draft gives a strong incentive to rule veterans out for the year. The more a team loses, the more they can spend in next year’s draft. The Phillies shut down Aaron Nola in August as a precaution, and they shut down Vince Velasquez after 131 innings. However, there aren’t as many examples of shutting down hitters.
4) There’s something about a team where their players tend to spend more or less time on the DL than the rest of the league. To test out this theory, I created variables for what proportion of a player’s games did he play for a particular team in a particular season. For example, Yoenis Cespedes only played for the Mets last year, so he gets a 1 for the Mets and a 0 for every other team. Jay Bruce played 95 games for Cincinnati and 50 for the Mets, so he gets 0.6599 for Cincinnati, 0.3401 for the Mets, 0 for the other teams. I added each team to the model. Since this can crash the statistical model, I only kept the two-team variables that were statistically significant.
- Pittsburgh Pirates who went on the DL spent 34.3 percent less time there than players at other organizations, controlling for other variables.
- San Diego Padres who went on the DL spent 41.42 percent more time there than players at other organizations, controlling for other variables.
This trend persisted over five years for both the Pirates and the Padres. I suspect this could be a difference in how two small budget teams construct their rosters. San Diego has a reputation for buying low in trades, acquiring talented but injury prone hitters like Wil Myers and Carlos Quentin. The Padres have struggled to develop hitters. San Diego’s great tacos only go so far in attracting hitters to the marine layer, so they tend to sign aging veterans with injury question marks. Meanwhile, the Pirates have emphasized restocking the lineup from within and rarely have a starting position player over 30. They seem to be doing a good job of avoiding risks.
Bottom Line: Are the Mets Doomed to Another Injury-Filled Season?
One of the great jokes about baseball is that for all the time and effort put it to quantifying the game, every day still has things you can’t predict. Do you remember Ruben Tejada hitting an inside-the-park home run in 2015? He pulled a liner down the first base line, just in front of Domonic Brown. The former Phillies prospect couldn’t slow down and tumbled over the short side wall, landing on his head. We were all cheering and laughing in the stands until Brown wobbled back to right field for the next batter. No one could predict that Brown’s career in Philly would end a few innings later after he was finally taken in for a concussion protocol. Some of the most serious injuries to position players are also the hardest to predict.
The good news is one serious injury doesn’t predict another serious injury the next season. All injuries are red flags for more injuries, but we shouldn’t worry about Duda any more than Cabrera. Of course, that’s not the default reaction because Duda missed so much of last year. If he has another back injury, we’ll say “of course he’s hurt again.” Sometimes we see patterns that aren’t really there, because the player who fits the pattern is easier to remember.
Last year’s Mets lost more position player days to injury than any other team in the last two years. Because long injuries one year don’t predict long injuries the next year, I think it’s a fairly safe bet that the 2017 Mets lineup will lose fewer days to injury. Every healthy player besides Jose Reyes is more likely to stay healthy than get injured. Last year, almost every regular got injured. That can happen, but it’s pretty bad luck. The most likely scenario is the Mets’ hitter injuries are a bit above average, but they regress towards the mean, just like the team’s clutch hitting should regress towards the mean after last year’s woes.
Once the season kicks into gear, I’ll take a look at the change to a 10-day disabled list and whether it makes sense for teams to be a bit more proactive when sending players to the DL.
#gorymath and other Notes:
1: Whether or not to treat a variable as a “count” variable is more of a technical issue than a conceptual one. Count variables cannot be negative. Players cannot spend a negative number of days on the disabled list. As much as Juan Pierre tried, he could not hit a negative number of home runs. Counts also have means that are much higher than the median, and high variance. If some of these technical conditions are not met, it may make more sense to use OLS regression, since that’s easier to interpret. For example, OLS is probably fine for games played.
Days on the disabled list is weird even for count variables because most DL stints have a 15 day minimum. However, the 15 day stay is the most common, then the 16-20 day range, and so on. This makes it a negative binomial distribution instead of a Poisson distribution.
2: If you want to try and learn some of these more advanced techniques, the Long and Freese book is probably the best textbook for Stata users. One warning about the zinb model: because it has two steps in one, there is much greater risk that the model will not converge. Having a larger sample size and fewer independent variables helps, but it’s not a foolproof situation. (I hammered away in futility for nearly two months while writing my dissertation!)
If you look this model up yourself, you will probably find disagreement on whether the two steps in the model need to have different independent variables. Stata’s short manual uses different sets of variables, implying this is a necessary condition for the model. Long and Freese use the same set of independent variables for both steps and argue this is not a problem. With baseball, we legitimately don’t know if prior injuries play a big role for both steps of the equation, so we should investigate.
3: I’m giving output as a picture because the formula is going to be illegible.
The Vuong test measures whether the zero-inflated model is gives a more accurate estimate than a one-step model, with a positive z score telling us yes. The likelihood test of alpha=0 tells us that a negative binomial model for the court half of the equation is preferable to the more basic Poisson model.
Stata’s “listcoef” command is useful here to help sort out what the other coefficients mean:
4: Technically there is a predicted probability of .0005 that someone is in the “at risk of injury” category but misses zero games. The zinb model always allows for this possibility. It makes a lot more sense if we are trying to measure the number of fish someone caught when they go camping. Only some campers will try to catch fish. Even if someone tries to fish, there is a reasonable chance they will come back with zero fish. My only time fishing I got my line caught on a tree branch!
5: If you have been scrolling down to read each footnote then jumping back up to the body, you know the answer is yes. If my teammates are more injured, my DL stay will tend to be longer as well. I will explain this more later. For now I wanted to clarify that teammate DL time was set to the median (276 days) for my initial prediction table. All other variables were set to the player’s actual value. Any prediction of “at risk of injury but zero games on DL” (from note 4) was put in the under 20 games on the DL category.
The zinb model also allows for the possibility that players will miss more time than exists in a season. It’s an unavoidable side effect of count models. I just put all these outcomes with the other 91 or more games missed bin.
6: I tried multiple categories, age as a linear variable, a few linear splines, and interaction terms with everything else in the model.
7: In most statistical models this would seem like a dodge or trick. With a zinb model, it’s pretty common. Stata’s manual uses a logit model to estimate if someone goes fishing then adds a variable for “did they use live bait” to predict how many fish they caught.
8: I dropped it to make the model easier to interpret and plug in for predictions. Here’s the alternate model with it included:
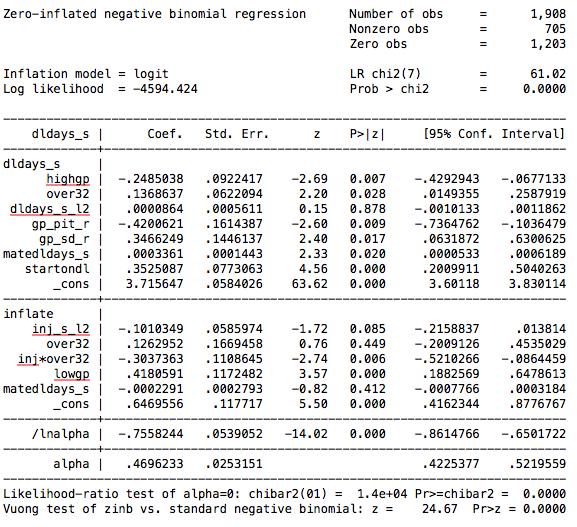
Photo credit: Andy Marlin – USA Today Sports
This was awesome even though I only understood about half of the analysis. I don’t remember from the previous article or this one but did you look at whether injuries happened to be to the same part of the body? I’d imagine that Reyes potentially has even higher odds of spending time on the disabled list given the recurring hamstring injuries vs. TDA. It looks like the BP transaction records would allow you to add a variable for ‘same part of body as previous’ vs. ‘different’.
Thanks for reading Josh!
You’re absolutely right that recurring injury to the same body part would be a good variable to add. It’s on my to-do list for some point during the season.